
Page 278 - Profile's Unit Trusts & Collective Investments - September 2025
P. 278
Camissa Equity Alpha Fund Domestic funds
Camissa Equity Alpha Fund
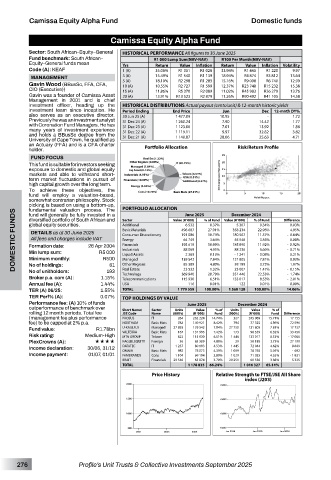
Sector: South African–Equity–General HISTORICAL PERFORMANCE All figures to 30 June 2025
Fund benchmark: South African– R1 000 Lump Sum(NAV-NAV) R100 Per Month(NAV-NAV)
Equity–General funds mean Yrs Return Value Inflation Return Value Inflation Volatility
Code (A): KEAF 1 (A) 35.06% R1 351 R1 028 33.94% R1 445 R1 220 9.97
3 (A) 15.49% R1 540 R1 139 18.94% R4 874 R3 812 13.64
MANAGEMENT
R9 008
R6 740
Gavin Wood (BBusSc, FFA, CFA, 5 (A) 18.10% R2 298 R1 283 15.16% R23 748 R15 232 12.99
10.55%
R1 599
10 (A)
R2 727
15.38
12.37%
CIO (Executive)) 15 (A) 11.86% R5 370 R2 089 11.02% R45 983 R26 279 13.76
Gavin was a founder of Camissa Asset 20 (A) 13.91% R13 523 R2 879 11.26% R90 492 R41 105 14.58
Management in 2001 and is chief
investment officer, heading up the HISTORICAL DISTRIBUTIONS Actual payout (cents/unit) & 12-month historic yields
investment team since inception. He Period Ending End Price Jun Dec 12-mnth DY%
also serves as an executive director. 30 Jun 25 (A) 1 477.09 10.95 - 1.72
Previously he was an investment analyst 31 Dec 24 (A) 1 260.24 7.90 14.42 1.77
with Coronation Fund Managers. He has 31 Dec 23 (A) 1 123.06 7.01 13.92 1.86
many years of investment experience 31 Dec 22 (A) 1 119.11 9.97 32.82 3.82
and holds a BBusSc degree from the 31 Dec 21 (A) 1 140.87 28.06 25.63 4.71
University of Cape Town, he qualified as
an Actuary (FFA) and is a CFA charter
holder. Portfolio Allocation Risk/Return Profile
FUND FOCUS
This fund is suitable for investors seeking
exposure to domestic and global equity
markets and able to withstand short-
term market fluctuations in pursuit of
high capital growth over the long term.
To achieve these objectives, the
fund will employ a valuation-based,
somewhat contrarian philosophy. Stock
picking is based on using a bottom-up, PORTFOLIO ALLOCATION June 2025 % of Fund Value (R ‘000) % of Fund Difference
fundamental valuation process. The
DOMESTIC FUNDS global equity securities. 26 Apr 2004 Additional 496 687 27.91% 358 234 - 0.08% - 0.84%
fund will generally be fully invested in a
December 2024
diversified portfolio of South African and
Value (R ‘000)
Sector
0.37%
0.34%
5 307
0.03%
6 532
22.96%
Basic Materials
4.95%
DETAILS as at 30 June 2025
10.74%
191 086
180 567
Consumer Discretionary
11.57%
All fees and charges include VAT
3.64%
64 749
3.56%
0.08%
55 548
Energy
- 0.92%
10.99%
195 619
11.92%
Formation date:
Financials
185 890
88 236
Industrials
5.66%
4.95%
- 0.71%
88 069
Min lump sum:
R5 000
- 1 241
Liquid Assets
0.13%
2 369
0.21%
R500
Minimum monthly:
7.84%
0.03%
121 805
Managed
139 542
7.81%
61
No of holdings:
1.07%
3.73%
58 189
85 389
4.80%
1.47%
1.32%
23 007
Real Estate
23 532
No of unitholders:
193
Technology
- 1.74%
Broker p.a. com (A): 1.15% Other Regions 369 940 20.79% 351 446 22.53% - 0.15%
Telecommunications
- 2.01%
115 930
6.51%
133 017
8.53%
Annual fee (A): 1.44% USA 116 0.01% 122 0.01% 0.00%
TER (A) 06/25: 1.55% TOTAL 1 779 559 100.00% 1 560 128 100.00% 14.06%
TER Perf% (A): 0.07% TOP HOLDINGS BY VALUE
Performance fee: (A) 10% of funds June 2025 December 2024
outperformance of benchmark over Short Name/ Sector Units Value % of Units Value % of
rolling 12 month periods. Total fee JSE Code Name (000’s) (R ‘000) Fund (000’s) (R ‘000) Fund Difference
(management fee plus performance PROSUS IT 264 262 224 14.74% 327 245 069 15.71% 17 155
fee) to be capped at 2% p.a. NORTHAM Basic Mats 782 149 921 8.42% 794 77 325 4.96% 72 596
Fund value: R1.78bn U-KAGLFLX Managed 27 893 139 542 7.84% 27 750 121 805 7.81% 17 737
98 539
173
33 456
Risk rating: Medium-High VALTERRA Basic Mats 167 131 995 7.42% 1 446 133 017 6.32% - 17 086
Telcom
6.51%
823
8.53%
MTN GROUP
115 930
PlexCrowns (A): «««« KAGLBLEQUITY Foreign 36 85 389 4.80% 29 58 189 3.73% 27 199
Income declaration: 30/06, 31/12 DATATEC IT Basic Mats 1 237 80 693 4.53% 1 445 72 044 4.62% 8 649
5.05%
982
OMNIA
- 692
78 073
78 765
1 009
4.39%
Income payment: 01/07, 01/01 FAMBRANDS Cons 1 104 69 194 3.89% 1 029 71 025 4.55% - 1 831
BRAIT Financials 29 540 65 874 3.70% 29 251 60 550 3.88% 5 325
TOTAL 1 178 835 66.24% 1 016 327 65.14%
Price History Relative Strength to FTSE/JSE All Share
index (J203)
276 Profile’s Unit Trusts & Collective Investments September 2025