
Page 277 - Profile's Unit Trusts & Collective Investments - September 2025
P. 277
Domestic funds Camissa Balanced Fund
Camissa Balanced Fund
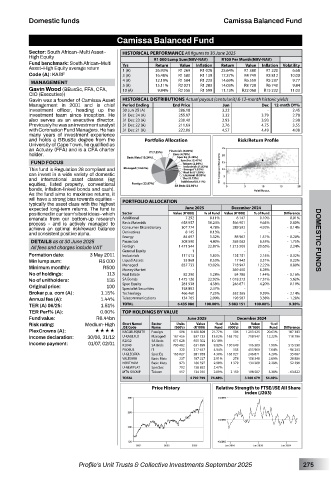
Sector: South African–Multi Asset– HISTORICAL PERFORMANCE All figures to 30 June 2025
High Equity R1 000 Lump Sum(NAV-NAV) R100 Per Month(NAV-NAV)
Fund benchmark: South African–Multi
Value
Value
Asset–High Equity average return Yrs Return R1 269 Inflation Return R1 380 Inflation Volatility
R1 028
1 (A)
25.64%
6.68
26.93%
R1 220
Code (A): KABF 3 (A) 16.48% R1 580 R1 139 17.37% R4 749 R3 812 10.00
4 (A) 12.19% R1 584 R1 223 14.69% R6 559 R5 237 9.77
MANAGEMENT 5 (A) 15.11% R2 021 R1 283 14.03% R8 728 R6 740 9.84
Gavin Wood (BBusSc, FFA, CFA, 10 (A) 9.84% R2 556 R1 599 11.13% R22 068 R15 232 11.03
CIO (Executive))
Gavin was a founder of Camissa Asset HISTORICAL DISTRIBUTIONS Actual payout (cents/unit) & 12-month historic yields
Management in 2001 and is chief Period Ending End Price Jun Dec 12-mnth DY%
investment officer, heading up the 30 Jun 25 (A) 286.18 3.22 - 2.45
investment team since inception. He 31 Dec 24 (A) 255.97 3.32 3.79 2.78
also serves as an executive director. 31 Dec 23 (A) 230.40 2.93 3.93 2.98
Previously he was an investment analyst 31 Dec 22 (A) 211.69 2.76 4.75 3.55
with Coronation Fund Managers. He has 31 Dec 21 (A) 222.06 4.57 4.49 4.08
many years of investment experience
and holds a BBusSc degree from the Portfolio Allocation Risk/Return Profile
University of Cape Town, he qualified as
an Actuary (FFA) and is a CFA charter
holder.
FUND FOCUS
This fund is Regulation 28 compliant and
can invest in a wide variety of domestic
and international asset classes (eg
equities, listed property, conventional
bonds, inflation-linked bonds and cash).
As the fund aims to maximise returns, it
will have a strong bias towards equities -
typically the asset class with the highest PORTFOLIO ALLOCATION
expected long-term returns. The fund is June 2025 December 2024
positioned in our team’s best ideas - which Sector Value (R ‘000) % of Fund Value (R ‘000) % of Fund Difference
emanate from our bottom-up research Additional 7 292 0.11% 6 147 0.10% 0.01%
process - and is actively managed to Basic Materials 658 957 10.24% 566 901 9.64% 0.60%
achieve an optimal risk/reward balance Consumer Discretionary 307 774 4.78% 289 592 4.92% - 0.14%
and consistent positive alpha. Derivatives 8 145 0.13% - - -
Energy 84 697 1.32% 88 967 1.51% - 0.20%
DETAILS as at 30 June 2025 Financials 308 590 4.80% 385 062 6.55% - 1.75% DOMESTIC FUNDS
All fees and charges include VAT Foreign 1 471 544 1 22.87% - 1 213 509 - 20.63% - 2.24% -
General Equity
Formation date: 3 May 2011 Industrials 117 013 1.82% 125 751 2.14% - 0.32%
Min lump sum: R5 000 Liquid Assets 33 868 0.53% 17 942 0.31% 0.22%
Minimum monthly: R500 Managed 837 733 - 13.02% - 718 947 12.22% 0.80% -
6.28%
369 450
Money Market
No of holdings: 113 Real Estate 82 290 1.28% 84 788 1.44% - 0.16%
No of unitholders: 135 SA Bonds 1 475 126 22.92% 1 018 272 17.31% 5.62%
Original price: 100 Spec Equity 281 938 4.38% 246 871 - 4.20% - 0.19% -
158 892
Specialist Securities
2.47%
Broker p.a. com (A): 1.15% Technology 466 460 7.25% 552 365 9.39% - 2.14%
Annual fee (A): 1.44% Telecommunications 134 765 2.09% 198 587 3.38% - 1.28%
TER (A) 06/25: 1.51% TOTAL 6 435 086 100.00% 5 883 151 100.00% 9.38%
TER Perf% (A): 0.00% TOP HOLDINGS BY VALUE
Fund value: R6.44bn June 2025 December 2024
Risk rating: Medium-High Short Name/ Sector (000’s) (R ‘000) Fund (000’s) (R ‘000) Fund Difference
% of
Value
Units
% of
Value
Units
JSE Code
Name
PlexCrowns (A): «««« KAGLBLEQUITY Foreign 596 1 400 808 21.77% 596 1 213 425 20.63% 187 383
Income declaration: 30/06, 31/12 U-KAGLFLX Managed 167 456 837 733 13.02% 163 792 718 947 12.22% 118 786
Income payment: 01/07, 02/01 R2032 SA Bnds 671 628 655 302 10.18% 130 649 - 116 309 - 1.98% - 515 590 -
9.82%
R2040
SA Bnds
631 899
700 482
PROSUS IT 320 317 637 4.94% 553 413 900 7.04% - 96 263
U-GLEQFKA Spec Eq 163 027 281 938 4.38% 163 027 246 871 4.20% 35 067
VALTERRA Basic Mats 237 187 227 2.91% 278 158 340 2.69% 28 886
NORTHAM Basic Mats 973 186 597 2.90% 1 379 134 300 2.28% 52 298
U-NEWPLAT SpecSec 702 158 892 2.47% - - - -
MTN GROUP Telcom 957 134 765 2.09% 2 159 198 587 3.38% - 63 822
TOTAL 4 792 799 74.48% 3 200 679 54.40%
Price History Relative Strength to FTSE/JSE All Share
index (J203)
Profile’s Unit Trusts & Collective Investments September 2025 275