
Page 281 - Profile's Unit Trusts & Collective Investments - September 2025
P. 281
Domestic funds Camissa Islamic Equity Fund
Camissa Islamic Equity Fund
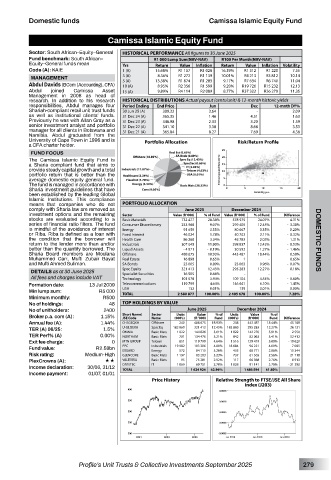
Sector: South African–Equity–General HISTORICAL PERFORMANCE All figures to 30 June 2025
Fund benchmark: South African– R1 000 Lump Sum(NAV-NAV) R100 Per Month(NAV-NAV)
Equity–General funds mean Yrs Return Value Inflation Return Value Inflation Volatility
Code (A): KAIE 1 (A) 15.68% R1 157 R1 028 16.39% R1 312 R1 220 7.55
3 (A) 8.36% R1 272 R1 139 10.01% R4 213 R3 812 10.14
MANAGEMENT 5 (A) 13.38% R1 874 R1 283 9.17% R7 634 R6 740 11.04
Abdul Davids (BCom (Accounting), CFA) 10 (A) 8.95% R2 356 R1 599 9.20% R19 726 R15 232 12.13
Abdul joined Camissa Asset 15 (A) 9.89% R4 114 R2 089 8.77% R37 322 R26 279 11.35
Management in 2008 as head of
research. In addition to his research HISTORICAL DISTRIBUTIONS Actual payout (cents/unit) & 12-month historic yields
responsibilities, Abdul manages four Period Ending End Price Jun Dec 12-mnth DY%
Shariah-compliant retail unit trust funds 30 Jun 25 (A) 389.32 3.64 - 2.09
as well as institutional clients’ funds. 31 Dec 24 (A) 365.35 1.46 4.51 1.63
Previously he was with Allan Gray as a 31 Dec 23 (A) 346.98 2.33 3.20 1.59
senior investment analyst and portfolio 31 Dec 22 (A) 341.10 3.38 8.66 3.53
manager for all clients in Botswana and 31 Dec 21 (A) 365.84 8.27 7.69 4.36
Namibia. Abdul graduated from the
University of Cape Town in 1996 and is Portfolio Allocation Risk/Return Profile
a CFA charter holder.
FUND FOCUS
The Camissa Islamic Equity Fund is
a Sharia compliant fund that aims to
provide steady capital growth and a total
portfolio return that is better than the
average domestic equity general fund.
The fund is managed in accordance with
Sharia investment guidelines that have
been established by the leading Global
Islamic Institutions. This compliance
means that companies who do not PORTFOLIO ALLOCATION
comply with Sharia law are removed as June 2025 December 2024
investment options and the remaining Sector Value (R ‘000) % of Fund Value (R ‘000) % of Fund Difference
stocks are evaluated according to a Basic Materials 732 477 28.38% 578 975 24.07% 4.31%
series of financial ratio filters. The fund Consumer Discretionary 233 968 9.07% 299 405 12.45% - 3.38%
is mindful of the avoidance of interest Energy 91 659 3.55% 80 667 3.35% 0.20%
or Riba. Riba is defined as a loan with Fixed Interest 46 024 1.78% 50 702 2.11% - 0.32%
the condition that the borrower will Health Care 86 268 3.34% 48 783 2.03% 1.31% DOMESTIC FUNDS
return to the lender more than and/or Industrials 307 045 11.90% 298 837 12.42% - 0.53%
better than the quantity borrowed. The Liquid Assets - 4 971 - 0.19% 30 592 1.27% - 1.46%
Sharia Board members are Moulana Offshore 488 675 18.93% 443 487 18.44% 0.50%
Muhammed Carr, Mufti Zubair Bayat Real Estate 16 898 0.65% 1 - 0.65%
and Mufti Ahmed Suliman. SA Bonds 23 005 0.89% 23 063 0.96% - 0.07%
DETAILS as at 30 June 2025 Spec Equity 321 413 12.45% 295 283 - 12.27% - 0.18% -
0.66%
Specialist Securities
16 905
All fees and charges include VAT Technology 101 578 3.94% 109 104 4.54% - 0.60%
Formation date: 13 Jul 2009 Telecommunications 119 799 4.64% 146 641 6.10% - 1.45%
0.00%
132
0.01%
0.01%
139
Min lump sum: R5 000 USA 2 580 877 100.00% 2 405 678 100.00% 7.28%
TOTAL
Minimum monthly: R500
No of holdings: 48 TOP HOLDINGS BY VALUE
No of unitholders: 2400 June 2025 December 2024
Units
% of
Value
Broker p.a. com (A): 1.15% Short Name/ Sector (000’s) (R ‘000) Fund (000’s) (R ‘000) Fund Difference
Units
Value
% of
Name
JSE Code
Annual fee (A): 1.44% O-ISGEQKA Offshore 240 488 675 18.93% 238 443 487 18.44% 45 188
TER (A) 06/25: 1.5% U-GLISEKA Spec Eq 182 860 321 413 12.45% 182 860 295 283 12.27% 26 131
1 822
1 822
5.61%
144 826
OMNIA
5.91%
Basic Mats
142 276
2 550
TER Perf% (A) 0.00% NORTHAM Basic Mats 701 134 476 5.21% 842 82 063 3.41% 52 412
Exit fee charge: 0 MTN GROUP Telcom 851 119 799 4.64% 1 516 139 419 5.80% - 19 620
7 085
Fund value: R2.58bn PPC Industrials 19 982 103 306 4.00% 18 684 96 221 4.00% 15 344
435
3.26%
68 771
572
84 115
EXXARO
2.86%
Energy
Risk rating: Medium-High GLENCORE Basic Mats 1 197 83 283 3.23% 737 61 565 2.56% 21 718
PlexCrowns (A): «« VALTERRA Basic Mats 95 75 281 2.92% 117 66 368 2.76% 8 913
3.79%
91 141
2.70%
69 751
Income declaration: 30/06, 31/12 DATATEC IT 1 069 1 624 924 62.96% 1 828 1 486 594 61.80% - 21 390
TOTAL
Income payment: 01/07, 01/01
Price History Relative Strength to FTSE/JSE All Share
index (J203)
Profile’s Unit Trusts & Collective Investments September 2025 279