
Page 285 - Profile's Unit Trusts & Collective Investments - September 2025
P. 285
Domestic funds Camissa SA Balanced Fund
Camissa SA Balanced Fund
Sector: South African–Multi Asset– HISTORICAL PERFORMANCE All figures to 30 June 2025
SA High Equity R1 000 Lump Sum(NAV-NAV) R100 Per Month(NAV-NAV)
Fund benchmark: South African Multi Yrs Return Value Inflation Return Value Inflation Volatility
Asset High Equity sector average 1 (A) 28.89% R1 289 R1 028 27.10% R1 392 R1 220 8.82
Code (A): KSALFA
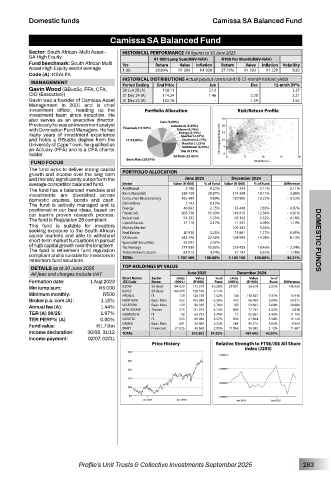
HISTORICAL DISTRIBUTIONS Actual payout (cents/unit) & 12-month historic yields
MANAGEMENT Period Ending End Price Jun Dec 12-mnth DY%
Gavin Wood (BBusSc, FFA, CFA, 30 Jun 25 (A) 128.11 2.12 - 3.37
CIO (Executive)) 31 Dec 24 (A) 114.24 1.46 2.20 3.21
Gavin was a founder of Camissa Asset 31 Dec 23 (A) 102.76 - 1.59 1.55
Management in 2001 and is chief
investment officer, heading up the Portfolio Allocation Risk/Return Profile
investment team since inception. He
also serves as an executive director.
Previously he was an investment analyst
with Coronation Fund Managers. He has
many years of investment experience
and holds a BBusSc degree from the
University of Cape Town, he qualified as
an Actuary (FFA) and is a CFA charter
holder.
FUND FOCUS
The fund aims to deliver strong capital
growth and income over the long term PORTFOLIO ALLOCATION
and thereby significantly outperform the June 2025 December 2024
average competitor balanced fund. Sector Value (R ‘000) % of Fund Value (R ‘000) % of Fund Difference
The fund has a balanced mandate and Additional 3 788 0.22% 1 343 0.11% 0.11%
investments are diversified across Basic Materials 358 105 20.97% 214 298 18.11% 2.86%
domestic equities, bonds and cash. Consumer Discretionary 165 489 9.69% 120 900 10.22% - 0.53%
The fund is actively managed and is Derivatives 2 143 0.13% - - -
positioned in our best ideas, based on Energy 46 992 2.75% 33 448 2.83% - 0.07%
our team’s proven research process. Financials 203 736 11.93% 148 410 12.54% - 0.61%
The fund is Regulation 28 compliant. Industrials 91 292 5.35% 65 342 5.52% - 0.18%
11 597
This fund is suitable for investors Liquid Assets 37 119 - 2.17% - 109 282 0.98% 1.19% -
Money Market
9.24%
seeking exposure to the South African Real Estate 20 930 1.23% 13 881 1.17% 0.05%
capital markets and able to withstand SA Bonds 382 746 22.42% 168 999 14.28% 8.13%
short-term market fluctuations in pursuit Specialist Securities 42 097 2.47% - - - DOMESTIC FUNDS
of high capital growth over the long term. Technology 271 959 15.93% 218 453 18.46% - 2.54%
The fund is retirement fund regulation Telecommunications 81 013 4.74% 77 197 6.52% - 1.78%
compliant and is suitable for investors in TOTAL 1 707 409 100.00% 1 183 150 100.00% 44.31%
retirement fund solutions.
DETAILS as at 30 June 2025 TOP HOLDINGS BY VALUE
All fees and charges include VAT June 2025 December 2024
% of
Units
Value
Units
Value
% of
Formation date: 1 Aug 2023 Short Name/ Sector (000’s) (R ‘000) Fund (000’s) (R ‘000) Fund Difference
Name
JSE Code
Min lump sum: R5 000 R2040 SA Bnds 194 630 175 574 10.28% 29 901 - 26 614 - 2.25% - 148 960 -
160 500
9.17%
SA Bnds
156 599
R2032
Minimum monthly: R500 PROSUS IT 128 126 739 7.42% 148 110 823 9.37% 15 916
Broker p.a. com (A): 1.15% NORTHAM Basic Mats 552 105 884 6.20% 472 46 009 3.89% 59 875
Annual fee (A): 1.44% VALTERRA Basic Mats 124 98 350 5.76% 105 59 662 5.04% 38 688
575
77 197
3 816
4.74%
81 013
6.52%
839
Telcom
MTN GROUP
TER (A) 06/25: 1.97% NASPERS-N IT 12 64 723 3.79% 13 52 967 4.48% 11 756
TER PERF% (A) 0.00% DATATEC IT 935 60 984 3.57% 839 41 864 3.54% 19 120
584
Fund value: R1.71bn OMNIA Basic Mats 21 825 54 967 3.22% 17 866 45 575 3.85% 11 687
9 393
691
36 983
3.13%
BRAIT
Financials
48 669
2.85%
Income declaration: 30/06, 31/12 TOTAL 973 502 57.02% 497 693 42.07%
Income payment: 02/07, 02/01
Price History Relative Strength to FTSE/JSE All Share
index (J203)
Profile’s Unit Trusts & Collective Investments September 2025 283