Page 288 - Profile's Unit Trusts & Collective Investments - September 2025
P. 288

Camissa Top 40 Tracker Fund                                    Domestic funds

                               Camissa Top 40 Tracker Fund
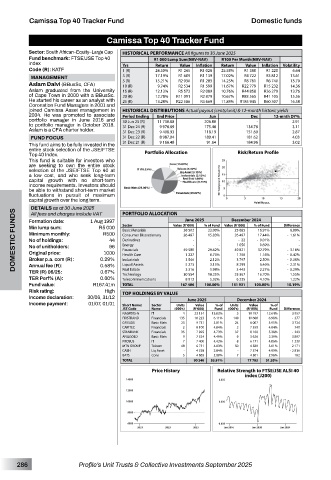
         Sector: South African–Equity–Large Cap  HISTORICAL PERFORMANCE All figures to 30 June 2025
         Fund benchmark: FTSE/JSE Top 40     R1 000 Lump Sum(NAV-NAV)  R100 Per Month(NAV-NAV)
         index                      Yrs      Return  Value  Inflation  Return  Value  Inflation  Volatility
         Code (R): KATF             1 (R)    24.50%  R1 245  R1 028  25.58%  R1 380  R1 220   6.64
                                    3 (R)    17.19%  R1 609  R1 139  17.02%  R4 722  R3 812   13.61
          MANAGEMENT
                                                                             R6 740
                                                                      R8 781
         Aslam Dalvi (BBusSc, CFA)  5 (R)    15.21%  R2 030  R1 283  14.25%  R22 779  R15 232   13.70
                                                    R2 534
                                    10 (R)
                                                          R1 599
                                              9.74%
                                                                                    14.36
                                                                11.67%
         Aslam  graduated  from  the  University   15 (R)  12.13%  R5 572  R2 089  10.76%  R44 858  R26 279   13.76
         of Cape Town in 2000 with a BBusSc.   20 (R)  12.78%  R11 091  R2 879  10.67%  R83 565  R41 105   15.56
         He started his career as an analyst with   25 (R)  13.28%  R22 586  R3 669  11.89%  R185 945  R60 307   16.58
         Coronation Fund Managers in 2001 and
         joined  Camissa  Asset  management  in   HISTORICAL DISTRIBUTIONS Actual payout (cents/unit) & 12-month historic yields
         2004.  He  was  promoted  to  associate   Period Ending  End Price  Jun  Dec  12-mnth DY%
         portfolio  manager  in  June  2016  and   30 Jun 25 (R)   11 730.88  206.80  -  2.91
         to  portfolio  manager  in  October  2018.   31 Dec 24 (R)   9 976.69  175.46  134.78  3.11
         Aslam is a CFA charter holder.  31 Dec 23 (R)   9 408.93  118.19  151.60   2.87
          FUND FOCUS                31 Dec 22 (R)   8 987.04  180.41   181.62       4.03
         This fund aims to be fully invested in the   31 Dec 21 (R)   9 166.48  91.64  184.96  3.02
         entire stock selection of the JSE/FTSE
         Top 40 Index.                    Portfolio Allocation       Risk/Return Profile
         This  fund  is  suitable  for  investors  who
         are  seeking  to  own  the  entire  stock
         selection  of  the  JSE/FTSE  Top  40  at
         a  low  cost,  and  who  seek  long-term

         capital  growth  with  no  short-term

         income requirements. Investors should
         be able to withstand short-term market
         fluctuations  in  pursuit  of  maximum
         capital growth over the long term.

          DETAILS as at 30 June 2025   PORTFOLIO ALLOCATION  June 2025  December 2024
     DOMESTIC FUNDS  Min lump sum:  R5 000  Sector  Value (R ‘000) - -  % of Fund - -  Value (R ‘000)  % of Fund  Difference - -
          All fees and charges include VAT
         Formation date:
                           1 Aug 1997
                                                                    25 685
                                                            23.00%
                                    Basic Materials
                                                     38 502
                                                                          16.91%
                                                                                   6.09%
         Minimum monthly:
                              R500
                                    Consumer Discretionary
                                                                                   -  1.61%
                                                            15.83%
                                                                          17.44%
                                                     26 497
                                                                    26 497
                                44
         No of holdings:
                                                                     -  22
                                    Derivatives
                                                                          -  0.01%
                                                                           0.69%
                                96
                                                                    1 050
         No of unitholders:
                                    Energy
                                                                                   -  3.18%
                                                                    49 821
                                                     49 580
                                                                          32.79%
                                                            29.62%
                                    Financials
                               1000
         Original price:
                                                      1 227
                                    Health Care
                                                                    1 758
                                                             0.73%
                                                                           1.16%
                                                                                   -  0.42%
                              0.29%
         Broker p.a. com (R):
                                                             2.12%
                                                                           2.50%
                                                      3 546
                                                                    3 797
         Annual fee (R):
                                                      5 273
                                                                                   -  2.31%
                                                                    8 299
                                                             3.15%
                                    Liquid Assets
                                                                           5.46%
                                                             1.98%
                                                                           2.27%
                                                      3 316
                                    Real Estate
                                                                    3 443
                                                                                   -  0.29%
         TER (R) 06/25:
                              0.67%
                                                                                   1.55%
                                    Technology
         TER Perf% (A):       0.58%  Industrials     30 554  18.25%  25 367  16.70%  -  0.38%
                              0.00%
                                                                    6 235
                                                      8 912
                                                                                   1.22%
                                                                           4.10%
                                    Telecommunications
                                                             5.32%
         Fund value:       R167.41m  TOTAL          167 406  100.00%  151 931  100.00%  10.19%
         Risk rating:          High  TOP HOLDINGS BY VALUE
         Income declaration:  30/06, 31/12            June 2025     December 2024
         Income payment:  01/07, 01/01  Short Name/    Sector   Units   Value   % of   Units   Value   % of
                                    JSE Code  Name  (000’s)  (R ‘000)  Fund  (000’s)  (R ‘000)  Fund  Difference
                                    NASPERS-N  IT    4  23 154  13.83%  5  19 197  12.64%  3 957
                                    FIRSTRAND  Financials  135  10 223  6.11%  140  10 600  6.98%  -  377
                                    GFIELDS  Basic Mats  23  9 731  5.81%  24  6 007  3.95%  3 724
                                    CAPITEC  Financials  2  8 100  4.84%  2  7 359  4.84%  740
                                    STANBANK  Financials  35  7 925  4.73%  37  8 168  5.38%  -  243
                                    ANGGOLD  Basic Mats  9  7 524  4.49%  9  3 626  2.39%  3 897
                                    PROSUS  IT       7   7 400  4.42%  8  6 171  4.06%  1 230
                                    MTN GROUP  Telcom  48  6 751  4.03%  50  4 580  3.01%  2 171
                                    CASH    Liq Asset  -  4 758  2.84%  -  7 574  4.99%  - 2 816
                                    BATS    Cons     5   4 683  2.80%  7  4 501  2.96%  182
                                    TOTAL               90 248  53.91%  77 783  51.20%
                                            Price History      Relative Strength to FTSE/JSE ALSI 40
                                                                       index (J200)


      286              Profile’s Unit Trusts & Collective Investments September 2025
   283   284   285   286   287   288   289   290   291   292   293