
Page 293 - Profile's Unit Trusts & Collective Investments - September 2025
P. 293
Domestic funds Marriott Dividend Growth Fund
Marriott Dividend Growth Fund
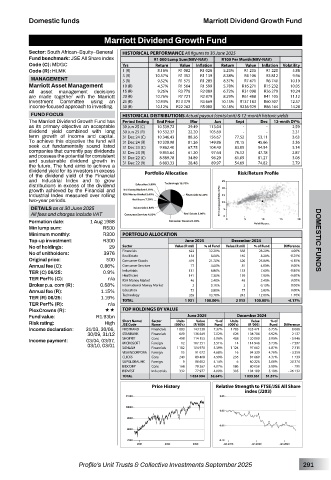
Sector: South African–Equity–General HISTORICAL PERFORMANCE All figures to 30 June 2025
Fund benchmark: JSE All Share index R1 000 Lump Sum(NAV-NAV) R100 Per Month(NAV-NAV)
Code (C): MDGC Yrs Return Value Inflation Return Value Inflation Volatility
Code (R): HLMK 1 (R) 8.16% R1 082 R1 028 5.23% R1 235 R1 220 5.88
3 (R) 10.57% R1 352 R1 139 8.38% R4 106 R3 812 9.96
MANAGEMENT 5 (R) 9.52% R1 575 R1 283 8.37% R7 471 R6 740 10.19
Marriott Asset Management 10 (R) 4.57% R1 564 R1 599 5.78% R16 271 R15 232 10.05
All asset management decisions 15 (R) 9.26% R3 776 R2 089 6.72% R31 098 R26 279 10.24
are made together with the Marriott 20 (R) 10.76% R7 721 R2 879 8.29% R61 488 R41 105 11.12
Investment Committee using an 25 (R) 10.93% R13 379 R3 669 10.15% R137 183 R60 307 12.57
income-focused approach to investing. 30 (R) 10.12% R22 262 R5 080 10.18% R236 929 R86 164 14.28
FUND FOCUS HISTORICAL DISTRIBUTIONS Actual payout (cents/unit) & 12-month historic yields
The Marriott Dividend Growth Fund has Period Ending End Price Mar Jun Sept Dec 12-mnth DY%
as its primary objective an acceptable 30 Jun 25 (C) 10 539.72 29.49 113.04 - - 2.59
dividend yield combined with long 30 Jun 25 (R) 10 532.37 22.20 105.69 - - 2.31
term growth of income and capital. 31 Dec 24 (C) 10 346.43 88.26 156.67 77.52 53.11 3.63
To achieve this objective the fund will 31 Dec 24 (R) 10 338.98 81.26 149.86 70.15 45.66 3.36
seek out fundamentally sound listed 31 Dec 23 (C) 9 862.40 67.75 104.40 83.05 54.54 3.14
companies that currently pay dividends 31 Dec 23 (R) 9 855.64 61.20 97.64 76.12 47.78 2.87
and possess the potential for consistent 31 Dec 22 (C) 8 889.78 34.89 96.29 61.09 81.27 3.08
and sustainable dividend growth in 31 Dec 22 (R) 8 883.33 28.48 89.97 54.69 74.82 2.79
the future. The fund aims to achieve a
dividend yield for its investors in excess
of the dividend yield of the Financial Portfolio Allocation Risk/Return Profile
and Industrial Index and to grow
distributions in excess of the dividend
growth achieved by the Financial and
Industrial Index measured over rolling
two-year periods.
DETAILS as at 30 June 2025
All fees and charges include VAT
Formation date: 1 Aug 1988
Min lump sum: R500
Minimum monthly: R300 PORTFOLIO ALLOCATION
Top-up investment: R300 June 2025 December 2024 DOMESTIC FUNDS
No of holdings: 29 Sector Value (R mil) % of Fund Value (R mil) % of Fund Difference
4.00%
No of unitholders: 3976 Financials 622 32.20% 568 28.20% -0.20%
Real Estate
165
8.20%
154
8.00%
Original price: 500 Consumer Goods 419 21.70% 520 25.80% -4.10%
Annual fee (C): 0.86% Consumer Services 77 4.00% 81 4.00% 0.00%
TER (C) 06/25: 0.9% Industrials 131 6.80% 153 7.60% -0.80%
159
Healthcare
7.90%
7.30%
141
-0.60%
TER Perf% (C): n/a RSA Money Market 46 2.40% 48 2.40% 0.00%
Broker p.a. com (R): 0.58% International Money Market 2 0.10% 2 0.10% 0.00%
Annual fee (R): 1.15% Education 73 3.80% 77 3.80% 0.00%
TER (R) 06/25: 1.19% Technology 265 13.70% 242 12.00% 1.70%
TER Perf% (R): n/a TOTAL 1 931 100.00% 2 015 100.00% -4.17%
PlexCrowns (R): «« TOP HOLDINGS BY VALUE
Fund value: R1.93bn June 2025 December 2024
Units
Value
% of
% of
Risk rating: High Short Name/ Sector (000’s) (R ‘000) Fund (000’s) (R ‘000) Fund Difference
Units
Value
Name
JSE Code
Income declaration: 31/03, 30/06, FIRSTRAND Financials 1 883 143 538 7.37% 1 783 135 471 6.75% 8 066
30/09, 31/12 STANBANK Financials 600 136 649 7.02% 626 138 786 6.92% - 2 137
Income payment: 03/04, 03/07, SHOPRIT Cons 408 114 153 5.86% 408 120 099 5.99% - 5 946
12
14
03/10, 03/01 MICROSOFT Foreign 1 182 107 351 5.51% 1 124 114 948 5.73% - 7 597
5.39%
104 978
SANLAM
7 315
97 662
Financials
4.87%
VISAINCORPORA Foreign 15 91 072 4.68% 16 94 330 4.70% - 3 259
CLICKS Cons 240 89 408 4.59% 235 87 669 4.37% 1 739
S&PGLOBALINC Foreign 9 80 602 4.14% 6 60 228 3.00% 20 374
BIDCORP Cons 168 79 267 4.07% 186 80 058 3.99% - 791
BIDVEST Industrials 332 77 977 4.00% 395 104 109 5.19% - 26 132
TOTAL 1 024 994 52.64% 1 033 361 51.51%
Price History Relative Strength to FTSE/JSE All Share
index (J203)
Profile’s Unit Trusts & Collective Investments September 2025 291