
Page 295 - Profile's Unit Trusts & Collective Investments - September 2025
P. 295
Domestic funds Marriott First World Equity Feeder Fund
Marriott First World Equity Feeder Fund
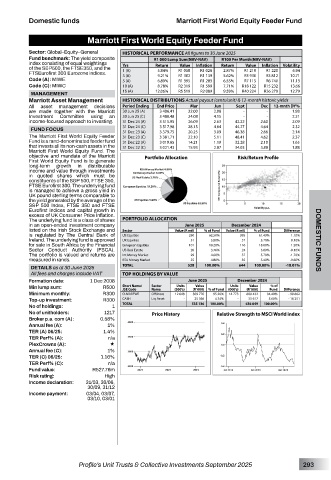
Sector: Global–Equity–General HISTORICAL PERFORMANCE All figures to 30 June 2025
Fund benchmark: The yield composite R1 000 Lump Sum(NAV-NAV) R100 Per Month(NAV-NAV)
index consisting of equal weightings
of the S&P500, the FTSE350, and the Yrs Return Value Inflation Return Value Inflation Volatility
6.94
FTSEurofirst 300 Eurozone indices. 1 (A) 5.84% R1 058 R1 028 2.87% R1 219 R1 220 10.71
5.62%
R1 139
R3 812
R1 302
9.21%
3 (A)
R3 930
Code (A): MIWE 5 (A) 6.89% R1 395 R1 283 6.55% R7 115 R6 740 11.13
Code (C): MIWC 10 (A) 8.78% R2 319 R1 599 7.71% R18 122 R15 232 13.66
15 (A) 12.06% R5 519 R2 089 9.59% R40 224 R26 279 12.79
MANAGEMENT
Marriott Asset Management HISTORICAL DISTRIBUTIONS Actual payout (cents/unit) & 12-month historic yields
All asset management decisions Period Ending End Price Mar Jun Sept Dec 12-mnth DY%
are made together with the Marriott 30 Jun 25 (A) 3 486.41 22.00 2.08 - - 1.98
Investment Committee using an 30 Jun 25 (C) 3 488.48 24.08 4.15 - - 2.21
income-focused approach to investing. 31 Dec 24 (A) 3 515.95 26.09 2.63 42.22 2.60 2.09
31 Dec 24 (C) 3 517.98 28.15 4.64 44.27 4.64 2.32
FUND FOCUS 31 Dec 23 (A) 3 379.75 20.25 3.09 46.38 2.66 2.14
The Marriott First World Equity Feeder 31 Dec 23 (C) 3 381.71 22.10 5.11 48.41 4.62 2.37
Fund is a rand-denominated feeder fund 31 Dec 22 (A) 3 019.65 14.21 1.19 32.28 2.10 1.65
that invests all its non-cash assets in the 31 Dec 22 (C) 3 021.43 15.93 2.87 34.03 3.88 1.88
Marriott First World Equity Fund. The
objective and mandate of the Marriott Portfolio Allocation Risk/Return Profile
First World Equity Fund is to generate
long-term growth in distributable
income and value through investments
in quoted shares which must be
constituents of the S&P 500, FTSE 350,
FTSE Eurofirst 300. The underlying fund
is managed to achieve a gross yield in
UK pound sterling terms comparable to
the yield generated by the average of the
S&P 500 Index, FTSE 350 and FTSE
Eurofirst indices and capital growth in
excess of UK Consumer Price Inflation.
The underlying fund is a class of shares PORTFOLIO ALLOCATION
in an open-ended investment company June 2025 December 2024
listed on the Irish Stock Exchange and Sector Value (R mil) % of Fund Value (R mil) % of Fund Difference
is regulated by The Central Bank of US Equities 330 62.50% 395 61.40% 1.10%
Ireland. The underlying fund is approved UK Equities 31 5.80% 37 5.70% 0.10% DOMESTIC FUNDS
for sale in South Africa by the Financial European Equities 101 19.20% 116 18.00% 1.20%
Sector Conduct Authority (FSCA). US Real Estate 20 3.70% 24 3.80% -0.10%
The portfolio is valued and returns are Int Money Market 29 4.00% 37 5.70% -1.70%
measured in rands. RSA Money Market 25 4.80% 35 5.40% -0.60%
DETAILS as at 30 June 2025 TOTAL 528 100.00% 644 100.00% -18.01%
All fees and charges include VAT TOP HOLDINGS BY VALUE
Formation date: 1 Dec 2008 June 2025 December 2024
Value
Units
% of
Units
Value
Min lump sum: R500 Short Name/ Sector (000’s) (R ‘000) % of Fund (000’s) (R ‘000) Fund Difference
Name
JSE Code
Minimum monthly: R300 O-MARFWE Offshore 12 648 509 770 95.26% 14 773 600 432 94.40% - 90 662
Top-up investment: R300 CASH Liq Asset - 25 366 4.74% - 35 617 5.60% - 10 251
No of holdings: 1 TOTAL 535 136 100.00% 636 049 100.00%
No of unitholders: 1217 Price History Relative Strength to MSCI World index
Broker p.a. com (A): 0.58%
Annual fee (A): 1%
TER (A) 06/25: 1.4%
TER Perf% (A): n/a
PlexCrowns (A): «
Annual fee (C): 1%
TER (C) 06/25: 1.16%
TER Perf% (C): n/a
Fund value: R527.76m
Risk rating: High
Income declaration: 31/03, 30/06,
30/09, 31/12
Income payment: 03/04, 03/07,
03/10, 03/01
Profile’s Unit Trusts & Collective Investments September 2025 293