
Page 297 - Profile's Unit Trusts & Collective Investments - September 2025
P. 297
Domestic funds Marriott High Income Fund of Funds
Marriott High Income Fund of Funds
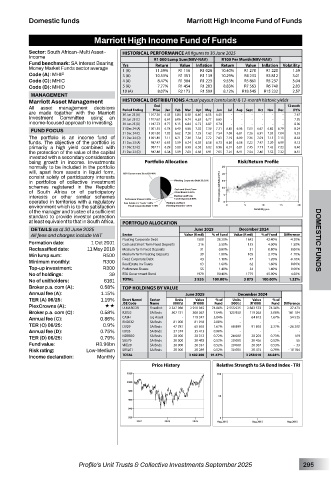
Sector: South African–Multi Asset– HISTORICAL PERFORMANCE All figures to 30 June 2025
Income R1 000 Lump Sum(NAV-NAV) R100 Per Month(NAV-NAV)
Fund benchmark: SA Interest Bearing
Value
Value
Money Market Funds sector average Yrs Return R1 116 Inflation Return R1 270 Inflation Volatility
R1 028
1 (A)
11.59%
10.40%
1.59
R1 220
Code (A): MHIF 3 (A) 10.53% R1 351 R1 139 10.29% R4 233 R3 812 3.01
Code (C): MHIC 4 (A) 8.47% R1 384 R1 223 9.53% R5 861 R5 237 3.04
Code (D): MHID 5 (A) 7.77% R1 454 R1 283 8.83% R7 563 R6 740 2.83
10 (A) 8.07% R2 173 R1 599 8.12% R18 545 R15 232 2.57
MANAGEMENT
Marriott Asset Management HISTORICAL DISTRIBUTIONS Actual payout (cents/unit) & 12-month historic yields
End
All asset management decisions Period Ending Price Jan Feb Mar Apr May Jun Jul Aug Sept Oct Nov Dec 12-mnth
DY%
are made together with the Marriott 30 Jun 25 (A) 1 017.38 6.43 5.84 6.50 6.40 6.53 6.41 - - - - - - 7.67
Investment Committee using an 30 Jun 25 (C) 1 017.63 6.67 6.06 6.74 6.63 6.77 6.65 - - - - - - 7.95
income-focused approach to investing. 30 Jun 25 (D) 1 017.73 6.77 6.15 6.84 6.73 6.87 6.74 - - - - - - 8.06
31 Dec 24 (A) 1 001.55 6.78 6.40 6.96 7.02 7.39 7.31 6.85 6.56 7.03 6.67 6.82 6.79 8.24
FUND FOCUS 31 Dec 24 (C) 1 001.80 7.02 6.62 7.20 7.25 7.62 7.54 7.09 6.81 7.26 6.91 7.05 7.04 8.53
The portfolio is an income fund of 31 Dec 24 (D) 1 001.89 7.11 6.71 7.30 7.34 7.72 7.63 7.19 6.90 7.36 7.01 7.15 7.13 8.64
funds. The objective of the portfolio is 31 Dec 23 (A) 987.47 6.05 5.59 6.74 6.35 6.58 6.73 6.68 6.58 7.22 7.47 7.20 6.99 8.12
primarily a high yield combined with 31 Dec 23 (C) 987.71 6.29 5.80 6.98 6.58 6.82 6.96 6.91 6.81 7.45 7.71 7.43 7.23 8.40
the protection of the value of the capital 31 Dec 23 (D) 987.80 6.38 5.89 7.08 6.68 6.91 7.05 7.01 6.91 7.54 7.80 7.52 7.32 8.51
invested with a secondary consideration
being growth in income. Investments Portfolio Allocation Risk/Return Profile
normally to be included in the portfolio
will, apart from assets in liquid form,
consist solely of participatory interests
in portfolios of collective investment
schemes registered in the Republic
of South Africa or of participatory
interests or other similar schemes
operated in territories with a regulatory
environment which is to the satisfaction
of the manager and trustee of a sufficient
standard to provide investor protection
at least equivalent to that in South Africa. PORTFOLIO ALLOCATION
DETAILS as at 30 June 2025 June 2025 December 2024
All fees and charges include VAT Sector Value (R mil) % of Fund Value (R mil) % of Fund Difference
Formation date: 1 Oct 2001 Floating Corporate Debt 1500 38.20% 1643 42.40% -4.20% DOMESTIC FUNDS
1.50%
Cash and Short Term Fixed Deposits
5.50%
4.00%
216
155
Reclassified date: 11 May 2018 Medium Term Fixed Deposits 31 0.80% 31 0.80% 0.00%
Min lump sum: R500 Medium Term Floating Deposits 39 1.00% 105 2.70% -1.70%
Minimum monthly: R300 Fixed Corporate Debt 43 1.10% 47 1.20% -0.10%
0.00%
63
1.60%
62
Real Estate Inv Trusts
1.60%
Top-up investment: R300 Preference Shares 55 1.40% 54 1.40% 0.00%
No of holdings: 39 RSA Government Bond 1979 50.40% 1779 45.90% 4.50%
No of unitholders: 6161 TOTAL 3 926 100.00% 3 875 100.00% 1.32%
Broker p.a. com (A): 0.58% TOP HOLDINGS BY VALUE
Annual fee (A): 1.15% June 2025 December 2024
TER (A) 06/25: 1.19% Short Name/ Sector Units Value % of Units Value % of
(R ‘000)
(R ‘000)
(000’s)
Fund
(000’s)
Fund
PlexCrowns (A): «« JSE Code Name 2 547 086 2 910 045 74.06% 2 555 925 2 882 572 74.36% Difference
27 473
U-MARCOR
Fixed Int
Broker p.a. com (C): 0.58% R2032 SA Bnds 307 751 300 367 7.64% 125 950 119 263 3.08% 181 104
Annual fee (C): 0.86% CASH Liq Asset - 119 347 3.04% - 64 812 1.67% 54 535
TER (C) 06/25: 0.9% RN2032 SA Bnds 81 000 81 918 2.08% 68 899 - 91 892 - 2.37% - - 26 200 -
1.67%
SA Bnds
47 781
I2029
65 692
Annual fee (D): 0.75% I2033 SA Bnds 27 374 35 413 0.90% - - - -
TER (D) 06/25: 0.79% NDBB02 SA Bnds 28 000 28 312 0.72% 28 000 28 203 0.73% 109
20 482
20 000
20 426
55
SBS79
SA Bnds
0.53%
20 000
0.52%
Fund value: R3.96bn VKE20 SA Bnds 20 000 20 334 0.52% 20 000 20 367 0.53% - 33
Risk rating: Low-Medium SBSL01 SA Bnds 20 000 20 289 0.52% 30 000 30 474 0.79% - 10 184
Income declaration: Monthly TOTAL 3 602 200 91.67% 3 258 010 84.04%
Price History Relative Strength to SA Bond Index - TRI
Profile’s Unit Trusts & Collective Investments September 2025 295