
Page 302 - Profile's Unit Trusts & Collective Investments - September 2025
P. 302
Marriott Property Equity Fund Domestic funds
Marriott Property Equity Fund
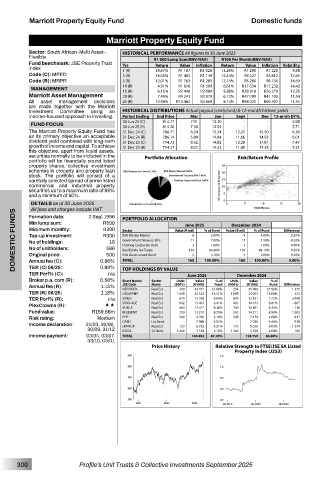
Sector: South African–Multi Asset– HISTORICAL PERFORMANCE All figures to 30 June 2025
Flexible R1 000 Lump Sum(NAV-NAV) R100 Per Month(NAV-NAV)
Fund benchmark: JSE Property Trust
Value
Value
index Yrs Return R1 187 Inflation Return R1 290 Inflation Volatility
R1 220
18.67%
1 (R)
13.26%
R1 028
9.88
Code (C): MPED 3 (R) 14.00% R1 482 R1 139 14.44% R4 527 R3 812 12.65
Code (R): MRPR 5 (R) 12.01% R1 763 R1 283 12.14% R8 280 R6 740 14.69
10 (R) 4.91% R1 616 R1 599 6.61% R17 034 R15 232 14.43
MANAGEMENT
15 (R) 6.15% R2 448 R2 089 5.88% R28 918 R26 279 12.25
Marriott Asset Management 20 (R) 7.49% R4 241 R2 879 6.12% R47 099 R41 105 11.54
All asset management decisions 25 (R) 10.96% R13 464 R3 669 8.14% R98 031 R60 307 11.55
are made together with the Marriott
Investment Committee using an HISTORICAL DISTRIBUTIONS Actual payout (cents/unit) & 12-month historic yields
income-focused approach to investing. Period Ending End Price Mar Jun Sept Dec 12-mnth DY%
30 Jun 25 (C) 814.77 7.91 13.10 - - 5.98
FUND FOCUS 30 Jun 25 (R) 814.20 7.38 12.53 - - 5.71
The Marriott Property Equity Fund has 31 Dec 24 (C) 786.71 6.34 15.34 12.21 15.50 6.28
as its primary objective an acceptable 31 Dec 24 (R) 786.14 5.84 14.84 11.66 14.93 6.01
dividend yield combined with long-term 31 Dec 23 (C) 714.73 8.52 14.82 12.28 17.81 7.47
growth of income and capital. To achieve 31 Dec 23 (R) 714.27 8.02 14.33 11.80 17.35 7.21
this objective, apart from liquid assets,
securities normally to be included in the Portfolio Allocation Risk/Return Profile
portfolio will be financially sound listed
property shares, collective investment
schemes in property and property loan
stock. The portfolio will consist of a
carefully selected spread of prime listed
commercial and industrial property
securities up to a maximum ratio of 85%
and a minimum of 50%.
DETAILS as at 30 June 2025 PORTFOLIO ALLOCATION
All fees and charges include VAT
DOMESTIC FUNDS Min lump sum: R500 Sector Value (R mil) 8 3 3 % of Fund Value (R mil) 8 3 3 % of Fund Difference
2 Sept 1996
Formation date:
June 2025
December 2024
R300
Minimum monthly:
R300
Top-up investment:
RSA Money Market
5.00%
4.80%
0.20%
-0.50%
7.50%
11
12
Government Treasury Bills
7.00%
No of holdings:
15
Floating Corporate Debt
0.00%
1.60%
1.60%
586
No of unitholders:
0.20%
135
84.30%
135
84.10%
Real Estate Inv Trusts
Original price:
500
2.10%
2.00%
RSA Government Bond
0.10%
Annual fee (C):
100.00%
160
0.89%
TER (C) 06/25:
TOP HOLDINGS BY VALUE
n/a
TER Perf% (C): 0.86% TOTAL 160 100.00% December 2024 0.00%
June 2025
Broker p.a. com (R): 0.58% Short Name/ Sector Units Value % of Units Value % of
Fund
Fund
Annual fee (R): 1.15% JSE Code Name (000’s) (R ‘000) 21.06% (000’s) (R ‘000) 21.92% Difference
249
35 006
Real Est
254
- 1 275
33 731
NEPIROCK
TER (R) 06/25: 1.18% GROWPNT Real Est 1 848 24 525 15.31% 1 889 24 053 15.06% 472
TER Perf% (R): n/a SIRIUS Real Est 670 15 769 9.84% 670 12 321 7.72% 3 448
PlexCrowns (R): «« STOR-AGE Real Est 842 13 467 8.41% 903 14 073 8.81% - 607
13 301
116
8.33%
13 417
Real Est
8.38%
684
740
VUKILE
Fund value: R159.66m RESILIENT Real Est 219 13 210 8.25% 242 14 211 8.90% - 1 002
Risk rating: Medium PHP Real Est 340 8 296 5.18% 340 7 479 4.68% 817
938
Income declaration: 31/03, 30/06, CASH Liq Asset 159 - 7 968 4.97% 173 - 7 030 4.40% - 1 274
HYPROP
4.21%
Real Est
8 026
6 752
5.03%
30/09, 31/12 R2032 SA Bnds 3 440 3 358 2.10% 3 440 3 258 2.04% 100
Income payment: 03/04, 03/07, TOTAL 140 493 87.70% 138 759 86.89%
03/10, 03/01
Price History Relative Strength to FTSE/JSE SA Listed
Property Index (J253)
300 Profile’s Unit Trusts & Collective Investments September 2025