
Page 303 - Profile's Unit Trusts & Collective Investments - September 2025
P. 303
Domestic funds Marriott Property Income Fund
Marriott Property Income Fund
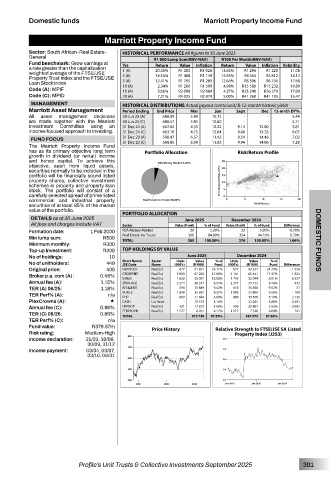
Sector: South African–Real Estate– HISTORICAL PERFORMANCE All figures to 30 June 2025
General R1 000 Lump Sum(NAV-NAV) R100 Per Month(NAV-NAV)
Fund benchmark: Grow earnings at
a rate greater than the capitalisation Yrs Return Value Inflation Return Value Inflation Volatility
weighted average of the FTSE/JSE 1 (A) 20.30% R1 203 R1 028 13.85% R1 294 R1 220 11.08
Property Trust index and the FTSE/JSE 3 (A) 14.16% R1 488 R1 139 14.95% R4 564 R3 812 14.12
Loan Stock index 5 (A) 12.41% R1 795 R1 283 12.64% R8 396 R6 740 17.68
Code (A): MPIF 10 (A) 2.34% R1 260 R1 599 4.98% R15 580 R15 232 19.80
17.00
R26 279
4.27%
R25 249
5.06%
R2 098
R2 089
15 (A)
Code (C): MPID 20 (A) 7.21% R4 025 R2 879 5.00% R41 260 R41 105 16.47
MANAGEMENT HISTORICAL DISTRIBUTIONS Actual payout (cents/unit) & 12-month historic yields
Marriott Asset Management Period Ending End Price Mar Jun Sept Dec 12-mnth DY%
All asset management decisions 30 Jun 25 (A) 688.09 5.40 10.12 - - 5.44
are made together with the Marriott 30 Jun 25 (C) 688.57 5.85 10.60 - - 5.71
Investment Committee using an 31 Dec 24 (A) 662.62 4.33 12.22 9.14 12.80 5.81
income-focused approach to investing. 31 Dec 24 (C) 663.10 4.75 12.64 9.60 13.28 6.07
31 Dec 23 (A) 598.47 6.57 11.42 9.54 14.48 7.02
FUND FOCUS
The Marriott Property Income Fund 31 Dec 23 (C) 598.85 6.99 11.83 9.94 14.86 7.28
has as its primary objective long term Portfolio Allocation Risk/Return Profile
growth in dividend (or rental) income
and hence capital. To achieve this
objective, apart from liquid assets,
securities normally to be included in the
portfolio will be financially sound listed
property shares, collective investment
schemes in property and property loan
stock. The portfolio will consist of a
carefully selected spread of prime listed
commercial and industrial property
securities of at least 85% of the market
value of the portfolio. PORTFOLIO ALLOCATION
DETAILS as at 30 June 2025 June 2025 December 2024
All fees and charges include VAT Sector Value (R mil) % of Fund Value (R mil) % of Fund Difference
Formation date: 1 Feb 2000 RSA Money Market 20 5.20% 22 5.90% -0.70%
0.70%
360
94.80%
94.10%
Min lump sum: R500 Real Estate Inv Trusts 380 100.00% 354 100.00% 1.06% DOMESTIC FUNDS
376
TOTAL
Minimum monthly: R300
Top-up investment: R300 TOP HOLDINGS BY VALUE
No of holdings: 10 June 2025 December 2024
Value
% of
Value
Units
% of
Units
No of unitholders: 449 Short Name/ Sector (000’s) (R ‘000) Fund (000’s) (R ‘000) Fund Difference
Name
JSE Code
Original price: 400 NEPIROCK Real Est 677 91 821 24.11% 677 93 377 24.79% - 1 556
Broker p.a. com (A): 0.58% GROWPNT Real Est 5 069 67 265 17.66% 5 141 65 441 17.37% 1 824
6 337
1 630
10.08%
38 381
1 742
8.51%
32 044
Real Est
SIRIUS
Annual fee (A): 1.15% STOR-AGE Real Est 2 274 36 354 9.54% 2 274 35 422 9.40% 932
TER (A) 06/25: 1.18% RESILIENT Real Est 594 35 889 9.42% 610 35 858 9.52% 31
TER Perf% (A): n/a VUKILE Real Est 1 818 35 691 9.37% 1 992 35 800 9.50% - 109
5.69%
889
889
5.19%
Real Est
2 135
21 684
PHP
19 550
PlexCrowns (A): « CASH Liq Asset - 19 574 5.14% - 22 065 5.86% - 2 491
Annual fee (C): 0.86% HYPROP Real Est 421 17 810 4.68% 450 20 897 5.55% - 3 087
2.00%
8 261
2.17%
7 520
TER (C) 06/25: 0.89% FTBPROPB Real Est 1 577 372 730 97.85% 1 577 367 973 97.69% 741
TOTAL
TER Perf% (C): n/a
Fund value: R379.57m
Risk rating: Medium-High Price History Relative Strength to FTSE/JSE SA Listed
Property Index (J253)
Income declaration: 31/03, 30/06,
30/09, 31/12
Income payment: 03/04, 03/07,
03/10, 06/01
Profile’s Unit Trusts & Collective Investments September 2025 301