
Page 300 - Profile's Unit Trusts & Collective Investments - September 2025
P. 300
Marriott International Real Estate Feeder Fund Domestic funds
Marriott International Real Estate Feeder Fund
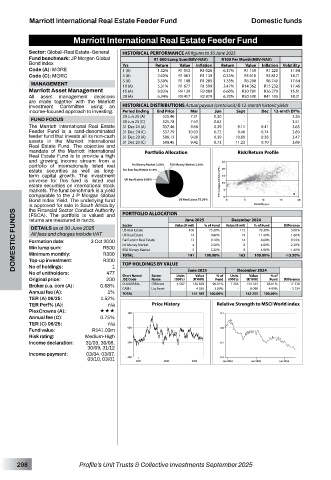
Sector: Global–Real Estate–General HISTORICAL PERFORMANCE All figures to 30 June 2025
Fund benchmark: JP Morgan Global R1 000 Lump Sum(NAV-NAV) R100 Per Month(NAV-NAV)
Bond index Yrs Return Value Inflation Return Value Inflation Volatility
Code (A): MGRE 1 (A) 1.32% R1 013 R1 028 -6.37% R1 159 R1 220 11.94
Code (C): MGRC 3 (A) 2.00% R1 061 R1 139 0.33% R3 618 R3 812 18.71
5 (A) 3.50% R1 188 R1 283 1.33% R6 208 R6 740 17.64
MANAGEMENT 10 (A) 5.31% R1 677 R1 599 3.47% R14 362 R15 232 17.46
Marriott Asset Management 15 (A) 9.93% R4 139 R2 089 6.60% R30 781 R26 279 15.51
All asset management decisions 20 (A) 6.34% R3 417 R2 879 6.70% R50 530 R41 105 18.21
are made together with the Marriott
Investment Committee using an HISTORICAL DISTRIBUTIONS Actual payout (cents/unit) & 12-month historic yields
income-focused approach to investing. Period Ending End Price Mar Jun Sept Dec 12-mnth DY%
30 Jun 25 (A) 525.46 7.31 0.30 - - 3.26
FUND FOCUS 30 Jun 25 (C) 525.78 7.63 0.62 - - 3.51
The Marriott International Real Estate 31 Dec 24 (A) 537.46 9.68 0.39 9.11 0.41 3.65
Feeder Fund is a rand-denominated 31 Dec 24 (C) 537.79 10.03 0.72 9.46 0.74 3.89
feeder fund that invests all its non-cash 31 Dec 23 (A) 598.13 9.08 0.39 10.89 0.38 3.47
assets in the Marriott International 31 Dec 23 (C) 598.45 9.42 0.73 11.23 0.70 3.69
Real Estate Fund. The objective and
mandate of the Marriott International Portfolio Allocation Risk/Return Profile
Real Estate Fund is to provide a high
and growing income stream from a
portfolio of internationally listed real
estate securities as well as long-
term capital growth. The investment
universe for this fund is listed real
estate securities on international stock
markets. The fund benchmark is a yield
comparable to the J P Morgan Global
Bond Index Yield. The underlying fund
is approved for sale in South Africa by PORTFOLIO ALLOCATION June 2025 December 2024
the Financial Sector Conduct Authority
DOMESTIC FUNDS Formation date: 3 Oct 2000 Sector Value (R mil) 4 5 % of Fund Value (R mil) 8 8 % of Fund Difference
(FSCA). The portfolio is valued and
returns are measured in rands.
DETAILS as at 30 June 2025
70.30%
US Real Estate
115
75.30%
106
5.00%
All fees and charges include VAT
11.40%
9.80%
14
-1.60%
19
UK Real Estate
Far Eastern Real Estate
9.10%
0.50%
13
14
8.60%
Int Money Market
-2.30%
4.80%
2.50%
R500
Min lump sum:
RSA Money Market
-1.60%
4.90%
3.30%
Minimum monthly:
R300
-13.50%
163
100.00%
100.00%
TOTAL
141
Top-up investment:
No of holdings:
477
No of unitholders: R300 1 TOP HOLDINGS BY VALUE Units June 2025 % of Units December 2024 % of
Value
Sector
Value
Short Name/
Original price: 200 JSE Code Name (000’s) (R ‘000) Fund (000’s) (R ‘000) Fund Difference
Broker p.a. com (A): 0.58% O-MARREAL Offshore 6 587 - 136 829 96.91% 7 256 - 154 165 95.01% - 17 336
- 3 734
8 090
4.99%
CASH
4 356
Liq Asset
3.09%
Annual fee (A): 1% TOTAL 141 185 100.00% 162 255 100.00%
TER (A) 06/25: 1.52%
TER Perf% (A): n/a Price History Relative Strength to MSCI World index
PlexCrowns (A): «««
Annual fee (C): 0.75%
TER (C) 06/25: n/a
Fund value: R141.03m
Risk rating: Medium-High
Income declaration: 31/03, 30/06,
30/09, 31/12
Income payment: 03/04, 03/07,
03/10, 03/01
298 Profile’s Unit Trusts & Collective Investments September 2025