
Page 299 - Profile's Unit Trusts & Collective Investments - September 2025
P. 299
Domestic funds Marriott International Growth Feeder Fund
Marriott International Growth Feeder Fund
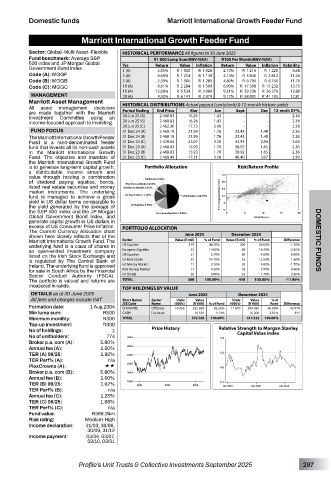
Sector: Global–Multi Asset–Flexible HISTORICAL PERFORMANCE All figures to 30 June 2025
Fund benchmark: Average S&P R1 000 Lump Sum(NAV-NAV) R100 Per Month(NAV-NAV)
500 index and JP Morgan Global
Value
Value
Government Bond index Yrs Return R 1 050 Inflation Return R 1 214 Inflation Volatility
2.10%
R 1 028
5.05%
6.68
1 (A)
R 1 220
Code (A): MGGF 3 (A) 6.69% R 1 214 R 1 139 4.14% R 3 840 R 3 812 11.26
Code (B): MGGB 5 (A) 5.39% R 1 300 R 1 283 4.80% R 6 794 R 6 740 11.76
Code (C): MGGC 10 (A) 8.61% R 2 284 R 1 599 6.90% R 17 308 R 15 232 13.73
15 (A) 12.08% R 5 534 R 2 089 9.31% R 39 236 R 26 279 12.80
MANAGEMENT 20 (A) 9.50% R 6 141 R 2 879 9.17% R 68 801 R 41 105 12.81
Marriott Asset Management
All asset management decisions HISTORICAL DISTRIBUTIONS Actual payout (cents/unit) & 12-month historic yields
are made together with the Marriott Period Ending End Price Mar Jun Sept Dec 12-mnth DY%
Investment Committee using an 30 Jun 25 (A) 2 460.83 16.26 1.43 - - 2.14
income-focused approach to investing. 30 Jun 25 (B) 2 460.83 16.26 1.43 - - 2.14
30 Jun 25 (C) 2 462.30 17.73 2.90 - - 2.38
FUND FOCUS 31 Dec 24 (A) 2 469.19 21.59 1.76 33.43 1.48 2.36
The Marriott International Growth Feeder 31 Dec 24 (B) 2 469.19 21.59 1.76 33.43 1.48 2.36
Fund is a rand-denominated feeder 31 Dec 24 (C) 2 470.65 23.07 3.20 34.91 2.94 2.60
fund that invests all its non-cash assets 31 Dec 23 (A) 2 468.03 15.93 1.70 38.92 1.65 2.36
in the Marriott International Growth 31 Dec 23 (B) 2 468.03 15.93 1.70 38.92 1.65 2.36
Fund. The objective and mandate of 31 Dec 23 (C) 2 469.45 17.31 3.18 40.40 3.07 2.59
the Marriott International Growth Fund
is to generate long-term capital growth, Portfolio Allocation Risk/Return Profile
a distributable income stream and
value through holding a combination
of dividend paying equities, bonds,
listed real estate securities and money
market instruments. The underlying
fund is managed to achieve a gross
yield in US dollar terms comparable to
the yield generated by the average of
the S&P 500 Index and the JP Morgan
Global Government Bond Index, and
generate capital growth in US dollars in
excess of US Consumer Price Inflation. PORTFOLIO ALLOCATION
The Current Currency Allocation chart
shown here closely reflects that of the June 2025 December 2024
Marriott International Growth Fund. The Sector Value (R mil) % of Fund Value (R mil) % of Fund Difference DOMESTIC FUNDS
underlying fund is a class of shares in US Equities 179 48.70% 209 50.00% -1.30%
an open-ended investment company European Equities 52 14.00% 68 16.30% -2.30%
listed on the Irish Stock Exchange and UK Equities 21 5.70% 20 4.80% 0.90%
is regulated by The Central Bank of Int Real Estate 52 14.10% 52 12.50% 1.60%
Ireland. The underlying fund is approved Int Money Market 11 3.10% 20 4.80% -1.70%
for sale in South Africa by the Financial RSA Money Market 17 4.50% 16 3.90% 0.60%
Sector Conduct Authority (FSCA). Int Bonds 36 9.90% 32 7.70% 2.20%
The portfolio is valued and returns are TOTAL 368 100.00% 418 100.00% -11.96%
measured in rands. TOP HOLDINGS BY VALUE
DETAILS as at 30 June 2025 June 2025 December 2024
All fees and charges include VAT Short Name/ Sector Units Value Units Value % of
Name
Fund
Formation date: 1 Aug 2004 JSE Code Offshore (000’s) (R ‘000) % of Fund (000’s) (R ‘000) 96.09% Difference
11 670
398 036
- 42 078
95.56%
O-MARINC
10 456
355 958
Min lump sum: R500 CASH Liq Asset - 16 550 4.44% - 16 206 3.91% 344
Minimum monthly: R300 TOTAL 372 508 100.00% 414 242 100.00%
Top-up investment: R300
No of holdings: 1 Price History Relative Strength to Morgan Stanley
Capital Value index
No of unitholders: 774
Broker p.a. com (A): 5.80%
Annual fee (A): 1.50%
TER (A) 06/25: 1.92%
TER Perf% (A): n/a
PlexCrowns (A): ««
Broker p.a. com (B): 5.80%
Annual fee (B): 1.50%
TER (B) 06/25: 1.92%
TER Perf% (B): n/a
Annual fee (C): 1.25%
TER (C) 06/25: 1.68%
TER Perf% (C): n/a
Fund value: R368.34m
Risk rating: Medium-High
Income declaration: 31/03, 30/06,
30/09, 31/12
Income payment: 03/04, 03/07,
03/10, 03/01
Profile’s Unit Trusts & Collective Investments September 2025 297