
Page 298 - Profile's Unit Trusts & Collective Investments - September 2025
P. 298
Marriott Income Fund Domestic funds
Marriott Income Fund
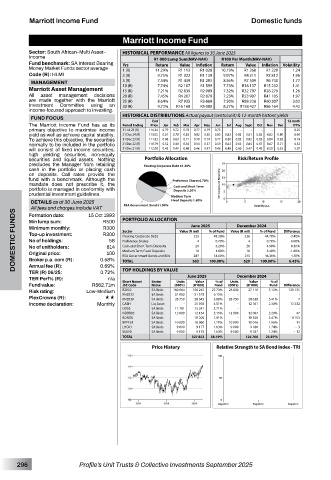
Sector: South African–Multi Asset– HISTORICAL PERFORMANCE All figures to 30 June 2025
Income R1 000 Lump Sum(NAV-NAV) R100 Per Month(NAV-NAV)
Fund benchmark: SA Interest Bearing Yrs Return Value Inflation Return Value Inflation Volatility
Money Market Funds sector average 1 (R) 11.29% R1 113 R1 028 10.19% R1 268 R1 220 1.24
Code (R): HLMI 3 (R) 9.75% R1 322 R1 139 9.97% R4 211 R3 812 1.96
5 (R) 7.54% R1 439 R1 283 8.56% R7 509 R6 740 1.77
MANAGEMENT 10 (R) 7.74% R2 107 R1 599 7.73% R18 137 R15 232 1.41
Marriott Asset Management 15 (R) 7.21% R2 839 R2 089 7.32% R32 797 R26 279 1.26
All asset management decisions 20 (R) 7.45% R4 207 R2 879 7.23% R53 907 R41 105 1.97
are made together with the Marriott 25 (R) 8.64% R7 935 R3 669 7.50% R88 226 R60 307 3.02
Investment Committee using an 30 (R) 9.72% R16 168 R5 080 8.27% R158 427 R86 164 4.42
income-focused approach to investing.
HISTORICAL DISTRIBUTIONS Actual payout (cents/unit) & 12-month historic yields
FUND FOCUS End 12-mnth
The Marriott Income Fund has as its Period Ending Price Jan Feb Mar Apr May Jun Jul Aug Sept Oct Nov Dec DY%
primary objective to maximise income 31 Jul 25 (R) 114.34 0.79 0.72 0.78 0.77 0.79 0.75 - - - - - - 8.25
yield as well as achieve capital stability. 31 Dec 24 (R) 113.05 0.81 0.78 0.83 0.82 0.85 0.83 0.83 0.83 0.81 0.82 0.82 0.80 8.69
To achieve this objective, the securities 31 Dec 23 (R) 111.83 0.68 0.63 0.71 0.70 0.74 0.77 0.80 0.82 0.82 0.83 0.84 0.82 8.19
normally to be included in the portfolio 31 Dec 22 (R) 110.79 0.52 0.48 0.55 0.54 0.57 0.59 0.63 0.65 0.64 0.67 0.67 0.71 6.52
will consist of fixed income securities, 31 Dec 21 (R) 112.08 0.45 0.41 0.48 0.46 0.47 0.46 0.48 0.50 0.47 0.49 0.50 0.53 5.07
high yielding securities, non-equity
securities and liquid assets. Nothing Portfolio Allocation Risk/Return Profile
precludes the Manager from retaining
cash in the portfolio or placing cash
on deposits. Call rates provide the
fund with a benchmark. Although the
mandate does not prescribe it, the
portfolio is managed in conformity with
prudential investment guidelines.
DETAILS as at 30 June 2025
All fees and charges include VAT R500 PORTFOLIO ALLOCATION
DOMESTIC FUNDS Minimum monthly: 0.58% Sector Value (R mil) 4 % of Fund Value (R mil) 4 % of Fund Difference
Formation date:
15 Oct 1993
Min lump sum:
December 2024
June 2025
R300
R300
Top-up investment:
-3.40%
Floating Corporate Debt
41.30%
233
236
44.70%
58
No of holdings:
0.00%
0.70%
Preference Shares
0.70%
No of unitholders:
814
29
0.30%
5.20%
Cash and Short Term Deposits
26
4.90%
18
10
1.80%
3.40%
Medium Term Fixed Deposits
-1.60%
100
Original price:
RSA Government Bonds and Bills
245
287
46.30%
4.70%
51.00%
Broker p.a. com (R):
100.00%
563
529
Annual fee (R):
TOP HOLDINGS BY VALUE
TER (R) 06/25:
0.72%
TER Perf% (R): 0.69% TOTAL Sector Units June 2025 100.00% Units December 2024 % of 6.43%
n/a
Value
Short Name/
Value
% of
Fund value: R562.71m JSE Code Name (000’s) (R ‘000) Fund (000’s) (R ‘000) Fund Difference
Risk rating: Low-Medium R2032 SA Bnds 160 084 156 245 27.73% 28 630 - 27 110 - 5.13% - 129 135 -
51 000
RN2032
SA Bnds
9.15%
51 578
PlexCrowns (R): «« RN2030 SA Bnds 28 750 28 645 5.08% 28 750 28 638 5.41% 7
Income declaration: Monthly CASH Liq Asset - 25 392 4.51% - 12 161 2.30% 13 232
I2033 SA Bnds 11 781 15 241 2.71% - - - -
NDBB02 SA Bnds 12 000 12 134 2.15% 12 000 12 087 2.29% 47
BONDS SA Bnds - 10 205 1.81% - 18 358 3.47% - 8 153
BPPF51 SA Bnds 10 000 10 060 1.79% 10 000 10 046 1.90% 14
LHC03 SA Bnds 9 000 9 177 1.63% 9 000 9 180 1.74% - 3
SSA10 SA Bnds 9 000 9 175 1.63% 9 000 9 187 1.74% - 12
TOTAL 327 852 58.19% 126 766 23.97%
Price History Relative Strength to SA Bond Index - TRI
296 Profile’s Unit Trusts & Collective Investments September 2025