Page 292 - Profile's Unit Trusts & Collective Investments - September 2025
P. 292

Marriott Core Income Fund                                      Domestic funds

                                 Marriott Core Income Fund
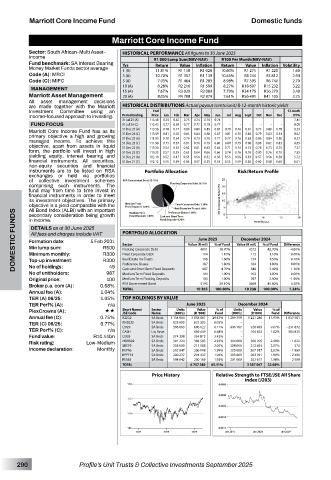
         Sector: South African–Multi Asset–  HISTORICAL PERFORMANCE All figures to 30 June 2025
         Income                              R1 000 Lump Sum(NAV-NAV)  R100 Per Month(NAV-NAV)
         Fund benchmark: SA Interest Bearing
                                                    Value
                                                                       Value
         Money Market Funds sector average  Yrs  Return  R1 118  Inflation  Return  R1 271  Inflation  Volatility
                                                          R1 028
                                                                             R1 220
                                                                                     1.60
                                    1 (A)
                                                                10.60%
                                             11.81%
         Code (A): MRCI             3 (A)    10.70%  R1 357  R1 139  10.46%  R4 244  R3 812   2.94
         Code (C): MIFC             5 (A)     7.93%  R1 464  R1 283  8.98%  R7 595  R6 740   2.79
                                    10 (A)    8.28%  R2 216  R1 599  8.27%  R18 697  R15 232   3.22
          MANAGEMENT                15 (A)    7.67%  R3 029  R2 089  7.79%  R34 175  R26 279   3.40
         Marriott Asset Management   20 (A)   8.05%  R4 708  R2 879  7.61%  R56 491  R41 105   3.75
         All   asset   management   decisions
         are  made  together  with  the  Marriott   HISTORICAL DISTRIBUTIONS Actual payout (cents/unit) & 12-month historic yields
         Investment   Committee   using   an   End                                 12-mnth
         income-focused approach to investing.  Period Ending  Price  Jan  Feb  Mar  Apr  May  Jun  Jul  Aug  Sept  Oct  Nov  Dec  DY%
                                    31 Jul 25 (A)    115.40  0.74  0.67  0.75  0.74  0.76  0.74  -  -  -  -  -  -  7.81
          FUND FOCUS                31 Jul 25 (C)    115.43  0.77  0.69  0.77  0.77  0.79  0.77  -  -  -  -  -  -  8.09
         Marriott  Core  Income  Fund  has  as  its   31 Dec 24 (A)    113.56  0.78  0.74  0.80  0.81  0.85  0.84  0.79  0.76  0.81  0.77  0.80  0.78  8.39
         primary  objective  a  high  and  growing   31 Dec 24 (C)    113.59  0.81  0.76  0.83  0.84  0.88  0.87  0.81  0.78  0.84  0.79  0.83  0.81  8.67
                                                           0.76
                                                                 0.77
                                                              0.77
                                               0.70
                                             111.95
                                                                                     8.27
                                    31 Dec 23 (A)
                                                        0.73
                                                     0.79
                                                  0.64
                                                                    0.76
                                                                             0.84
                                                                                0.80
                                                                       0.83
                                                                          0.86
         managed  income.  To  achieve  this   31 Dec 23 (C)    111.98  0.73  0.67  0.81  0.76  0.79  0.80  0.80  0.79  0.86  0.88  0.87  0.83  8.55
         objective,  apart  from  assets  in  liquid   31 Dec 22 (A)    110.30  0.54  0.53  0.62  0.61  0.63  0.64  0.71  0.74  0.74  0.78  0.73  0.75  7.27
         form,  the  portfolio  will  invest  in  high   31 Dec 22 (C)    110.33  0.57  0.55  0.65  0.64  0.66  0.66  0.74  0.76  0.76  0.80  0.76  0.78  7.55
         yielding  equity,  interest  bearing  and   31 Dec 21 (A)    112.10  0.52  0.47  0.53  0.54  0.52  0.50  0.53  0.56  0.53  0.57  0.56  0.58  5.72
         financial  instruments.  All  securities,   31 Dec 21 (C)    112.12  0.55  0.49  0.56  0.57  0.55  0.53  0.56  0.59  0.56  0.60  0.58  0.60  6.01
         non-equity  securities  and  financial
         instruments  are  to  be  listed  on  RSA   Portfolio Allocation  Risk/Return Profile
         exchanges  or  held  via  portfolios
         of  collective  investment  schemes
         comprising  such  instruments.  The                            
         fund  may  from  time  to  time  invest  in
         financial  instruments  in  order  to  meet
         its  investment  objectives.  The  primary
         objective is a yield comparable with the
                                                                     

         All Bond Index (ALBI) with an important
                                                       ­      €   	 
      ‚
     DOMESTIC FUNDS  Formation date:  5 Feb 2001  PORTFOLIO ALLOCATION  Value (R mil)  % of Fund  Value (R mil)  % of Fund  Difference

                                                 ƒ  „    …            
         secondary  consideration  being  growth


         in income.
                                                              
          DETAILS as at 30 June 2025
          All fees and charges include VAT
                                                                      December 2024
                                                         June 2025
                                    Sector
         Min lump sum:
                              R500
                                                                        4372
                                                                             42.70%
                                                                                   -4.00%
                                                          4011
                                                               38.70%
                                    Floating Corporate Debt
                              R300
         Minimum monthly:
                                                                1.10%
                                    Fixed Corporate Debt
                                                                        113
                                                           114
                                                                              1.10%
                                                                                    0.00%
         Top-up investment:
                                                                              1.80%
                                                           187
                                                                                    0.00%
                                                                1.80%
                                                                        184
                                    Preference Shares
                                49
         No of holdings:
                                                                                    1.30%
                                                                              3.40%
                                    Cash and Short Term Fixed Deposits
                                                                4.70%
                                                                        348
                                                           487
                               987
         No of unitholders:   R300  Real Estate Inv Trusts  166  1.60%  154   1.50%  0.10%
                                                                              1.00%
                                                                        102
                                                           104
                                    Medium Term Fixed Deposits
                                                                1.00%
                                                                                    0.00%
         Original price:       100  Medium Term Floating Deposits  104  1.00%  297  2.90%  -1.90%
                                                                             45.60%
                                                                                    4.50%
                                                               50.10%
                                                          5193
                                                                        4669
         Broker p.a. com (A):  0.58%  RSA Government Bond  10 365  100.00%  10 238  100.00%  1.24%
                                    TOTAL
         Annual fee (A):      1.04%
         TER (A) 06/25:       1.05%  TOP HOLDINGS BY VALUE
         TER Perf% (A):         n/a                   June 2025      December 2024
                                                                   Units
         PlexCrowns (A):       ««   Short Name/    Sector   (000’s)  (R ‘000)  Fund  (000’s)  (R ‘000)  Fund  Difference
                                                                         Value
                                                                              % of
                                                         Value
                                                   Units
                                                              % of
                                    JSE Code
                                            Name
         Annual fee (C):      0.75%  R2032  SA Bnds  3 134 064  3 058 867  29.47%  1 289 759  1 221 286  11.93%  1 837 581
         TER (C) 06/25:       0.77%  RN2032  SA Bnds  823 000  832 325  8.02%  -  -  -  -
         TER Perf% (C):         n/a  I2029  SA Bnds  506 683 -  696 622  6.71%  696 167 -  928 493  9.07%  - 231 872
                                            Liq Asset
                                                                        104 624
                                                                                   584 825
                                    CASH
                                                              6.64%
                                                                              1.02%
                                                        689 449
         Fund value:        R10.44bn  I2033  SA Bnds  274 308  354 873  3.42%  -  -  -  -
         Risk rating:     Low-Medium  NDBB02  SA Bnds  301 224  304 583  2.93%  304 000  306 205  2.99%  - 1 622
                                                                                     574
         Income declaration:  Monthly  SBS79  SA Bnds  208 000  213 008  2.05%  208 000  212 434  2.07%  - 1 869
                                                                              2.03%
                                            SA Bnds
                                                        206 048
                                                                  205 000
                                                              1.99%
                                    PEP06
                                                  202 847
                                                                        207 917
                                    BPPF51  SA Bnds  200 237  201 437  1.94%  203 000  203 931  1.99%  - 2 494
                                    RES63   SA Bnds  198 842  200 169  1.93%  201 000  202 677  1.98%  - 2 508
                                    TOTAL              6 757 380  65.11%  3 387 567  33.08%
                                            Price History     Relative Strength to FTSE/JSE All Share
                                                                       index (J203)


      290               Profile’s Unit Trusts & Collective Investments September 2025
   287   288   289   290   291   292   293   294   295   296   297