
Page 291 - Profile's Unit Trusts & Collective Investments - September 2025
P. 291
Domestic funds Marriott Balanced Fund of Funds
Marriott Balanced Fund of Funds
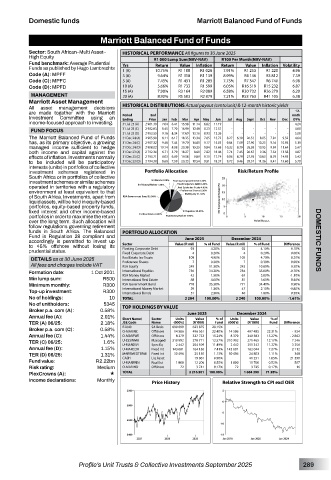
Sector: South African–Multi Asset– HISTORICAL PERFORMANCE All figures to 30 June 2025
High Equity R1 000 Lump Sum(NAV-NAV) R100 Per Month(NAV-NAV)
Fund benchmark: Average Prudential
Value
Value
Funds as published by Hugo Lambrechts Yrs Return R1 108 Inflation Return R1 253 Inflation Volatility
10.75%
1 (A)
R1 220
4.96
R1 028
7.91%
Code (A): MPFF 3 (A) 9.64% R1 318 R1 139 8.99% R4 146 R3 812 7.39
Code (C): MPFC 5 (A) 7.43% R1 431 R1 283 7.75% R7 347 R6 740 6.98
Code (D): MPFD 10 (A) 5.66% R1 733 R1 599 6.05% R16 519 R15 232 6.87
15 (A) 7.98% R3 164 R2 089 6.58% R30 732 R26 279 6.20
MANAGEMENT 20 (A) 8.90% R5 503 R2 879 7.21% R53 763 R41 105 6.38
Marriott Asset Management
All asset management decisions HISTORICAL DISTRIBUTIONS Actual payout (cents/unit) & 12-month historic yields
12-
are made together with the Marriott Period End mnth
Investment Committee using an Ending Price Jan Feb Mar Apr May Jun Jul Aug Sept Oct Nov Dec DY%
income-focused approach to investing. 31 Jul 25 (A) 2 981.39 7.04 6.41 15.58 11.14 6.82 11.19 - - - - - - 4.24
31 Jul 25 (C) 2 982.83 8.45 7.70 16.99 12.48 8.23 12.57 - - - - - - 4.80
FUND FOCUS 31 Jul 25 (D) 2 983.55 9.16 8.34 17.69 13.16 8.93 13.26 - - - - - - 5.08
The Marriott Balanced Fund of Funds 31 Dec 24 (A) 2 905.90 8.11 6.17 18.35 13.34 7.85 13.72 8.27 6.30 26.53 8.85 7.81 9.52 4.64
has, as its primary objective, a growing 31 Dec 24 (C) 2 907.32 9.46 7.44 19.70 14.61 9.17 15.03 9.64 7.69 27.90 10.25 9.16 10.94 5.19
managed income sufficient to hedge 31 Dec 24 (D) 2 908.02 10.14 8.08 20.38 15.25 9.84 15.68 10.32 8.39 28.58 10.95 9.84 11.64 5.47
both income and capital against the 31 Dec 23 (A) 2 792.36 6.71 5.79 18.27 8.60 7.82 16.46 7.74 7.45 26.67 9.36 7.54 13.58 4.87
effects of inflation. Investments normally 31 Dec 23 (C) 2 793.71 8.03 6.99 19.58 9.89 9.15 17.74 9.06 8.79 27.93 10.63 8.79 14.93 5.42
to be included will be participatory 31 Dec 23 (D) 2 794.38 8.68 7.59 20.23 10.54 9.81 18.37 9.72 9.46 28.57 11.26 9.41 15.60 5.70
interests (units) in portfolios of collective
investment schemes registered in Portfolio Allocation Risk/Return Profile
South Africa or in portfolios of collective
investment schemes or similar schemes
operated in territories with a regulatory
environment at least equivalent to that
of South Africa. Investments, apart from
liquid assets, will be held in equity-based
portfolios, equity-based property funds,
fixed interest and other income-based
portfolios in order to maximise the return
over the long term. Such allocation will
follow regulations governing retirement
funds in South Africa. The Balanced PORTFOLIO ALLOCATION
Fund is Regulation 28 compliant and June 2025 December 2024
accordingly is permitted to invest up DOMESTIC FUNDS
to 45% offshore without losing its Sector Value (R mil) % of Fund Value (R mil) % of Fund Difference
Floating Corporate Debt
92
4.20%
93
4.10%
0.10%
prudential status. Fixed Corporate Debt 4 0.20% 4 0.20% 0.00%
DETAILS as at 30 June 2025 Real Estate Inv Trusts 108 7 4.90% 105 7 4.70% 0.20%
Preference Shares
0.30%
0.30%
0.00%
All fees and charges include VAT RSA Equity 249 11.30% 242 10.80% 0.50%
Formation date: 1 Oct 2001 International Equities 756 34.30% 784 35.00% -0.70%
1.90%
67
42
-1.10%
RSA Money Market
3.00%
Min lump sum: R500 International Real Estate 88 4.00% 81 3.60% 0.40%
Minimum monthly: R300 RSA Government Bond 778 35.30% 771 34.40% 0.90%
Top-up investment: R300 International Money Market 29 1.30% 47 2.10% -0.80%
2.30%
International Bonds
40
51
0.50%
1.80%
No of holdings: 10 TOTAL 2 204 100.00% 2 240 100.00% -1.61%
No of unitholders: 5345 TOP HOLDINGS BY VALUE
Broker p.a. com (A): 0.58% June 2025 December 2024
Annual fee (A): 2.01% Short Name/ Sector Units Value % of Units Value % of
TER (A) 06/25: 2.18% JSE Code Name (000’s) (R ‘000) Fund (000’s) (R ‘000) Fund Difference
Broker p.a. com (C): 0.58% R2040 SA Bnds 690 890 623 875 28.15% 14 586 - 497 485 - 22.31% - - 924 -
22.40%
496 561
14 586
Offshore
O-MARINC
Annual fee (C): 1.44% O-MARFWE Offshore 8 379 337 722 15.24% 8 379 340 583 15.27% - 2 862
TER (C) 06/25: 1.6% U-ESSINMA Managed 310 992 278 711 12.57% 310 992 271 465 12.17% 7 246
2 442
2 442
Annual fee (D): 1.15% U-MARDIVI Spec Eq 143 681 254 599 11.49% 143 681 251 342 11.27% 3 256
Fixed Int
162 044
7.27%
2 112
7.41%
164 156
U-MARCOR
TER (D) 06/25: 1.31% MARRMEDTERMI Fixed Int 30 496 25 150 1.13% 30 496 24 803 1.11% 348
Fund value: R2.22bn CASH Liq Asset 1 800 - 19 861 0.90% 1 800 - 41 251 1.85% - 21 390
507
0.55%
0.52%
11 700
12 206
U-MARPRIN
Real Est
Risk rating: Medium O-MARIND Offshore 72 3 741 0.17% 72 3 725 0.17% 16
PlexCrowns (A): « TOTAL 2 216 581 100.00% 1 604 398 71.95%
Income declarations: Monthly Price History Relative Strength to CPI excl OER
Profile’s Unit Trusts & Collective Investments September 2025 289