Page 286 - Profile's Unit Trusts & Collective Investments - September 2025
P. 286

Camissa SA Equity Fund                                         Domestic funds

                                  Camissa SA Equity Fund
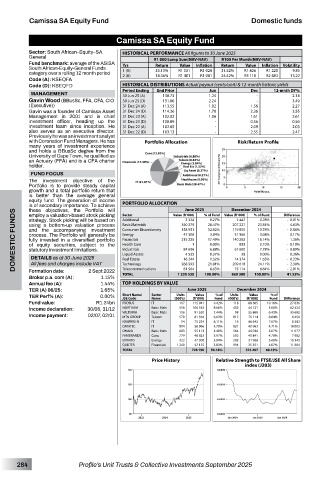
         Sector: South African–Equity–SA   HISTORICAL PERFORMANCE All figures to 30 June 2025
         General                             R1 000 Lump Sum(NAV-NAV)  R100 Per Month(NAV-NAV)
         Fund benchmark: average of the ASISA
         South African-Equity-General Funds   Yrs  Return  Value  Inflation  Return  Value  Inflation  Volatility
                                                                                     9.85
         category over a rolling 12 month period  1 (A)  33.13%  R1 331  R1 028  31.52%  R1 426  R1 220   13.22
                                    2 (A)
                                                    R1 401
                                                          R1 081
                                                                      R3 118
                                                                24.42%
                                                                             R2 483
                                             18.36%
         Code (A): KSEQFA
         Code (D): KSEQFD           HISTORICAL DISTRIBUTIONS Actual payout (cents/unit) & 12-month historic yields
                                    Period Ending  End Price  Jun       Dec    12-mnth DY%
          MANAGEMENT                30 Jun 25 (A)    130.73  1.24         -         2.14
         Gavin Wood (BBusSc, FFA, CFA, CIO   30 Jun 25 (D)    131.86  2.24  -       3.49
         (Executive))               31 Dec 24 (A)    113.55  1.02       1.56        2.27
         Gavin was a founder of Camissa Asset   31 Dec 24 (D)    114.36  1.70  2.36  3.55
         Management  in  2001  and  is  chief   31 Dec 23 (A)    102.02  1.06  1.61  2.61
         investment  officer,  heading  up  the   31 Dec 23 (D)    100.89  -  0.56  0.56
         investment  team  since  inception.  He   31 Dec 22 (A)    102.65  -  2.09  2.03
         also  serves  as  an  executive  director.   31 Dec 22 (D)    103.13  -  2.55  2.47
         Previously he was an investment analyst
         with Coronation Fund Managers. He has   Portfolio Allocation  Risk/Return Profile
         many  years  of  investment  experience
         and  holds  a  BBusSc  degree  from  the
         University of Cape Town, he qualified as
         an Actuary (FFA) and is a CFA charter
         holder.


          FUND FOCUS
         The  investment  objective  of  the
         Portfolio  is  to  provide  steady  capital
         growth  and  a  total  portfolio  return  that
         is  better  than  the  average  general
         equity  fund.  The  generation  of  income
         is of secondary importance. To achieve   PORTFOLIO ALLOCATION  June 2025 % of Fund  Value (R ‘000)  % of Fund  Difference
                                                                   December 2024
         these  objectives,  the  Portfolio  will
     DOMESTIC FUNDS  using  a  bottom-up  valuation  process   Basic Materials  350 279 1  28.47%  207 227  23.84%  -  0.86%
         employ a valuation-based stock picking
                                    Sector
                                                  Value (R ‘000)
         strategy. Stock picking will be based on
                                                                                   -  0.01%
                                    Additional
                                                                           0.28%
                                                                    2 447
                                                             0.27%
                                                      3 324
                                                                                   4.63%
         and  the  accompanying  investment
                                                                          13.78%
                                                                   119 800
                                                     158 951
                                    Consumer Discretionary
                                                            12.92%
         process. The Portfolio will generally be
                                                                           3.68%
                                                                                   0.17%
                                                     47 308
                                                             3.84%
                                                                    31 966
                                    Energy
         fully  invested  in  a  diversified  portfolio
                                                                                   1.36%
                                                     215 225
                                    Financials
                                                                          16.14%
                                                                   140 262
                                                            17.49%
         of  equity  securities,  subject  to  the
                                                                                   -  0.10%
                                    Health Care
                                                                     855
                                                                           0.10%
                                                             0.00%
         statutory investment limitations.
                                                             6.88%
                                                                    67 600
                                                                                   -  0.89%
                                                                           7.78%
                                    Industrials
                                                     84 696
                                    Liquid Assets
                                                                                   0.36%
                                                                           0.00%
                                                                      38
                                                             0.37%
                                                      4 535
          DETAILS as at 30 June 2025
                                                                           1.65%
                                                                                   -  0.33%
                                                             1.32%
                                                                    14 374
                                                     16 244
                                    Real Estate
          All fees and charges include VAT
                                                                   209 618
                                                     268 393
                                                                          24.11%
                                                            21.81%
                                                                           8.64%
                                                                    75 114
                                    Telecommunications
                                                             6.63%
                                                                                   -  2.01%
                                                     81 564
         Formation date:
                                                                                   41.55%
                                    TOTAL
                              1.15%
         Broker p.a. com (A):  2 Sept 2022  Technology  1 230 520  100.00%  869 300  100.00%  -  2.30%
         Annual fee (A):      1.44%  TOP HOLDINGS BY VALUE
         TER (A) 06/25:       1.65%                   June 2025     December 2024
                                                                        Value
                                                         Value
                                                                  Units
                                                              % of
                                                                              % of
                                                   Units
         TER Perf% (A):       0.00%  Short Name/    Sector   (000’s)  (R ‘000)  Fund  (000’s)  (R ‘000)  Fund  Difference
                                            Name
                                    JSE Code
         Fund value:        R1.24bn  PROSUS  IT     117  115 941  9.42%  118  88 305  10.16%  27 636
         Income declaration:  30/06, 31/12  NORTHAM  Basic Mats  556  106 545  8.66%  453  44 121  5.08%  62 424
                                                                    98
         Income payment:  02/07, 02/01  VALTERRA  Basic Mats  116  91 550  7.44%  817  55 868  6.43%  35 682
                                                              6.63%
                                                    579
                                                                             8.64%
                                    MTN GROUP
                                                                        75 114
                                                        81 564
                                            Telcom
                                                                                    6 450
                                    NASPERS-N  IT   14  75 224  6.11%  16  66 642  7.67%  8 582
                                    DATATEC  IT     904  58 966  4.79%  821  40 963  4.71%  18 003
                                    OMNIA   Basic Mats  693  55 113  4.48%  564  44 036  5.07%  11 077
                                    FAMBRANDS  Cons  779  48 823  3.97%  592  40 841  4.70%  7 982
                                    EXXARO  Energy  322  47 308  3.84%  202  31 966  3.68%  15 343
                                    QUILTER  Financials  1 240  47 155  3.83%  994  35 351  4.07%  11 804
                                    TOTAL               728 190  59.18%  523 207  60.19%
                                            Price History     Relative Strength to FTSE/JSE All Share
                                                                       index (J203)


      284              Profile’s Unit Trusts & Collective Investments September 2025
   281   282   283   284   285   286   287   288   289   290   291