
Page 275 - Profile's Unit Trusts & Collective Investments - March 2025
P. 275
Marriott Essential Income Fund
Marriott Essential Income Fund
Marriott Essential Income Fund
Sector: South African—Multi Asset—
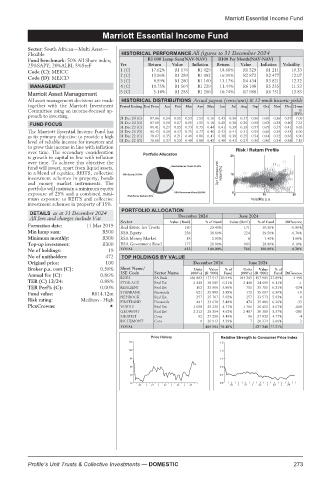
Flexible HISTORICAL PERFORMANCE All figures to 31 December 2024
Fund benchmark: 50% All Share index; R1 000 Lump Sum(NAV-NAV) R100 Per Month(NAV-NAV)
25%SAPY; 20%ALBI; 5%SteF Yrs Return Value Inflation Return Value Inflation Volatility
Code (C): MEICC 1 (C) 17.62% R1 176 R1 029 18.66% R1 329 R1 211 10.33
Code (D): MEICD 2 (C) 13.96% R1 299 R1 082 16.91% R2 872 R2 477 12.07
3 (C) 8.59% R1 280 R1 160 13.17% R4 434 R3 821 12.32
MANAGEMENT 4 (C) 10.75% R1 504 R1 229 11.44% R6 108 R5 255 11.53
5 (C) 5.14% R1 285 R1 266 10.74% R7 968 R6 751 13.83
Marriott Asset Management
All asset management decisions are made HISTORICAL DISTRIBUTIONS Actual payout (cents/unit) & 12-mnth historic yields
together with the Marriott Investment Period Ending End Price Jan Feb Mar Apr May Jun Jul Aug Sep Oct Nov Dec 12-mn
Committee using an income-focused ap- th
proach to investing. 31 Dec 24 (C) 87.66 0.54 0.15 0.53 1.53 0.16 0.43 0.36 0.17 0.96 0.60 0.36 0.37 DY%
7.06
FUND FOCUS 31 Dec 24 (D) 87.69 0.56 0.17 0.55 1.55 0.18 0.45 0.38 0.20 0.98 0.63 0.38 0.40 7.33
31 Dec 23 (C) 80.41 0.27 0.15 0.73 0.75 0.44 0.41 0.39 0.19 0.57 0.65 0.37 0.41 6.63
The Marriott Essential Income Fund has 31 Dec 23 (D) 80.43 0.29 0.17 0.75 0.77 0.46 0.43 0.41 0.21 0.59 0.66 0.39 0.43 6.90
as its primary objective to provide a high 31 Dec 22 (C) 78.07 0.35 0.21 0.46 0.86 0.41 0.38 0.39 0.25 0.54 0.84 0.32 0.36 6.90
level of reliable income for investors and 31 Dec 22 (D) 78.09 0.37 0.23 0.48 0.88 0.43 0.40 0.41 0.27 0.56 0.86 0.34 0.38 7.19
to grow this income in line with inflation
over time. The secondary consideration Risk / Return Profile
is growth in capital in line with inflation 25
over time. To achieve this objective the
fund will invest, apart from liquid assets,
in a blend of equities, REITS, collective 3yr Compound return(%) 12
investment schemes in property, bonds
and money market instruments. The
portfolio will maintain a minimum equity
exposure of 25% and a combined mini- 0 0 10 20
mum exposure to REITS and collective Volatility p.a.
investment schemes in property of 15%.
PORTFOLIO ALLOCATION
DETAILS as at 31 December 2024
All fees and charges include Vat December 2024 June 2024
Sector Value (Rmil) % of Fund Value (Rmil) % of Fund Difference
Formation date: 11 Mar 2019 Real Estate Inv Trusts 180 29.40% 171 30.30% -0.90%
Min lump sum: R500 RSA Equity 238 38.80% 224 39.50% -0.70%
Minimum monthly: R300 RSA Money Market 18 2.90% 8 1.40% 1.50%
Top-up investment: R300 RSA Govenment Bond 177 28.90% 163 28.80% 0.10%
No of holdings: 19 TOTAL 613 100.00% 566 100.00% 8.30%
No of unitholders: 472 TOP HOLDINGS BY VALUE
Original price: 100 December 2024 June 2024
Broker p.a. com (C): 0.58% Short Name/ Units Value %of Units Value %of
JSE Code Sector Name (000’s) (R ‘000) Fund (000’s) (R ‘000) Fund Difference
Annual fee (C): 0.86%
R2035 SA Bnds 188 883 177 517 28.94% 184 385 157 985 27.89% 4 498
TER (C) 12/24: 0.88% STOR-AGE Real Est 2 448 38 085 6.21% 2 448 34 609 6.11% -1
TER Perf% (C): 0.00% RESILIENT Real Est 162 35 960 5.86% 755 35 755 6.31% -134
Fund value: R614.12m STANBANK Financials 621 35 889 5.85% 172 35 697 6.30% -10
Risk rating: Medium - High NEPIROCK Real Est 257 35 707 5.82% 257 33 573 5.93% 0
FIRSTRAND Financials 441 33 630 5.48% 474 35 480 6.26% -33
PlexCrowns: VUKILE Real Est 1 658 29 239 4.77% 1 766 26 452 4.67% -108
GROWPNT Real Est 2 212 28 354 4.62% 2 497 30 389 5.37% -285
SHOPRIT Cons 92 27 290 4.45% 96 27 032 4.77% -4
RICHEMONT Cons 9 26 913 4.39% 7 20 374 3.60% 2
TOTAL 468 584 76.40% 437 346 77.21%
Price History Relative Strength to Consumer Price Index
110 1.5
102 1.3
94 1.1
86 0.9
78 0.7
70 0.5
20 | 21 | 22 | 23 | 24 20 | 21 | 22 | 23 | 24
Profile’s Unit Trusts & Collective Investments — DOMESTIC 273