
Page 280 - Profile's Unit Trusts & Collective Investments - March 2025
P. 280
Marriott International Growth Feeder Fund
Marriott International Growth Feeder Fund
Marriott International Growth Feeder Fund
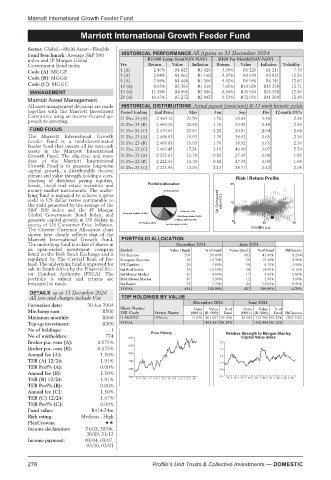
Sector: Global—Multi Asset—Flexible
Fund benchmark: Average S&P 500 HISTORICAL PERFORMANCE All figures to 31 December 2024
index and JP Morgan Global R1 000 Lump Sum(NAV-NAV) R100 Per Month(NAV-NAV)
Government Bond index Yrs Return Value Inflation Return Value Inflation Volatility
Code (A): MGGF 1 (A) 2.47% R1 025 R1 029 3.99% R1 226 R1 211 7.79
Code (B): MGGB 3 (A) 2.04% R1 062 R1 160 5.47% R3 920 R3 821 12.59
R1 468
7.98%
R6 996
R1 266
5.92%
5 (A)
12.87
R6 751
Code (C): MGGC 10 (A) 8.95% R2 356 R1 618 7.61% R18 020 R15 258 13.71
MANAGEMENT 15 (A) 11.28% R4 968 R2 086 9.94% R41 564 R26 338 12.89
20 (A) 10.43% R7 272 R2 883 9.53% R72 051 R41 309 12.99
Marriott Asset Management
All asset management decisions are made HISTORICAL DISTRIBUTIONS Actual payout (cents/unit) & 12-mnth historic yields
together with the Marriott Investment Period Ending End Price Mar Jun Sep Dec 12-mnth DY%
Committee using an income-focused ap- 31 Dec 24 (A) 2 469.19 21.59 1.76 33.43 1.48 2.36
proach to investing.
31 Dec 24 (B) 2 469.19 21.59 1.76 33.43 1.48 2.36
FUND FOCUS 31 Dec 24 (C) 2 470.65 23.07 3.20 34.91 2.94 2.60
The Marriott International Growth 31 Dec 23 (A) 2 468.03 15.93 1.70 38.92 1.65 2.36
Feeder Fund is a rand-denominated 31 Dec 23 (B) 2 468.03 15.93 1.70 38.92 1.65 2.36
feeder fund that invests all its non-cash
assets in the Marriott International 31 Dec 23 (C) 2 469.45 17.31 3.18 40.40 3.07 2.59
Growth Fund. The objective and man- 31 Dec 22 (A) 2 222.61 11.70 0.82 27.43 1.08 1.85
date of the Marriott International 31 Dec 22 (B) 2 222.61 11.70 0.82 27.43 1.08 1.85
Growth Fund is to generate long-term 31 Dec 22 (C) 2 223.95 13.03 2.12 28.77 2.42 2.08
capital growth, a distributable income
stream and value through holding a com-
bination of dividend paying equities, Risk / Return Profile
bonds, listed real estate securities and 25
money market instruments. The under-
lying fund is managed to achieve a gross
yield in US dollar terms comparable to 3yr Compound return(%)
the yield generated by the average of the 12
S&P 500 Index and the JP Morgan
Global Government Bond Index, and
generate capital growth in US dollars in 0
excess of US Consumer Price Inflation. 0 10 20
The Current Currency Allocation chart Volatility p.a.
shown here closely reflects that of the
Marriott International Growth Fund. PORTFOLIO ALLOCATION
The underlying fund is a class of shares in December 2024 June 2024
an open-ended investment company Sector Value (Rmil) % of Fund Value (Rmil) % of Fund Difference
listed on the Irish Stock Exchange and is US Equities 209 50.00% 183 41.80% 8.20%
regulated by The Central Bank of Ire- European Equities 68 16.30% 59 13.40% 2.90%
land. The underlying fund is approved for UK Equities 20 4.80% 38 8.70% -3.90%
sale in South Africa by the Financial Sec- Int Real Estate 52 12.50% 64 14.60% -2.10%
tor Conduct Authority (FSCA). The Int Money Market 20 4.80% 17 4.00% 0.80%
portfolio is valued and returns are RSA Money Market 16 3.90% 12 2.90% 1.00%
measured in rands. Int Bonds 32 7.70% 64 14.60% -6.90%
TOTAL 418 100.00% 437 100.00% -4.35%
DETAILS as at 31 December 2024
All fees and charges include Vat TOP HOLDINGS BY VALUE
December 2024 June 2024
Formation date: 30 Jun 2004 Short Name/
Value
%of
Units
Units
Value
%of
Min lump sum: R500 JSE Code Sector Name (000’s) (R ‘000) Fund (000’s) (R ‘000) Fund Difference
Minimum monthly: R300 O-MARINC Offshore 11 670 401 607 96.10% 12 503 412 484 95.12% (833 106)
Top-up investment: R300 TOTAL 401 607 96.10% 412 484 95.12%
No of holdings: 1
Price History Relative Strength to Morgan Stanley
No of unitholders: 774 2600 Capital Value index
Broker p.a. com (A): 0.575% 2.0
2320
Broker p.a. com (B): 0.575% 1.7
Annual fee (A): 1.50% 2040 1.4
TER (A) 12/24: 1.91% 1760 1.1
TER Perf% (A): 0.00% 1480 0.8
Annual fee (B): 1.50%
1200 0.5
TER (B) 12/24: 1.91% 15 | 16 | 17 | 18 | 19 | 20 | 21 | 22 | 23 | 24 15 | 16 | 17 | 18 | 19 | 20 | 21 | 22 | 23 | 24
TER Perf% (B): 0.00%
Annual fee (C): 1.50%
TER (C) 12/24: 1.67%
TER Perf% (C): 0.00%
Fund value: R414.24m
Risk rating: Medium - High
PlexCrowns:
Income declaration: 31/03, 30/06,
30/09, 31/12
Income payment: 03/04, 03/07,
03/10, 03/01
278 Profile’s Unit Trusts & Collective Investments — DOMESTIC