
Page 281 - Profile's Unit Trusts & Collective Investments - March 2025
P. 281
Marriott International Real Estate Feeder Fund
Marriott International Real Estate Feeder Fund
Marriott International Real Estate Feeder Fund
Sector: Global—Real Estate—General
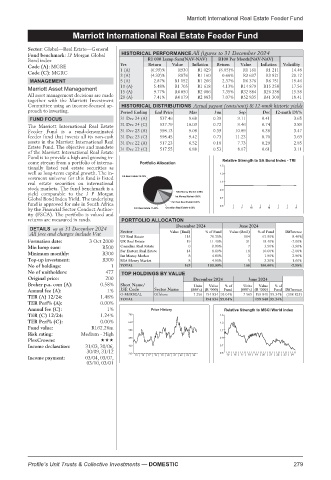
Fund benchmark: JP Morgan Global HISTORICAL PERFORMANCE All figures to 31 December 2024
Bond index R1 000 Lump Sum(NAV-NAV) R100 Per Month(NAV-NAV)
Code (A): MGRE Yrs Return Value Inflation Return Value Inflation Volatility
Code (C): MGRC 1 (A) (6.99)% R930 R1 029 (6.05)% R1 161 R1 211 14.48
3 (A) (4.33)% R876 R1 160 0.66% R3 637 R3 821 20.12
MANAGEMENT 5 (A) 2.87% R1 152 R1 266 2.37% R6 376 R6 751 19.46
10 (A) 5.48% R1 705 R1 618 4.13% R14 879 R15 258 17.56
Marriott Asset Management 15 (A) 9.77% R4 050 R2 086 7.35% R32 884 R26 338 15.58
All asset management decisions are made 20 (A) 7.41% R4 179 R2 883 7.07% R52 835 R41 309 18.41
together with the Marriott Investment
Committee using an income-focused ap- HISTORICAL DISTRIBUTIONS Actual payout (cents/unit) & 12-mnth historic yields
proach to investing. Period Ending End Price Mar Jun Sep Dec 12-mnth DY%
FUND FOCUS 31 Dec 24 (A) 537.46 9.68 0.39 9.11 0.41 3.65
The Marriott International Real Estate 31 Dec 24 (C) 537.79 10.03 0.72 9.46 0.74 3.89
Feeder Fund is a rand-denominated 31 Dec 23 (A) 598.13 9.08 0.39 10.89 0.38 3.47
feeder fund that invests all its non-cash 31 Dec 23 (C) 598.45 9.42 0.73 11.23 0.70 3.69
assets in the Marriott International Real 31 Dec 22 (A) 517.23 6.52 0.18 7.73 0.29 2.85
Estate Fund. The objective and mandate 31 Dec 22 (C) 517.55 6.88 0.53 8.07 0.61 3.11
of the Marriott International Real Estate
Fund is to provide a high and growing in-
come stream from a portfolio of interna- Relative Strength to SA Bond Index - TRI
tionally listed real estate securities as 1.5
well as long-term capital growth. The in- 1.3
vestment universe for this fund is listed
real estate securities on international 1.1
stock markets. The fund benchmark is a 0.9
yield comparable to the J P Morgan
Global Bond Index Yield. The underlying 0.7
fund is approved for sale in South Africa 0.5
by the Financial Sector Conduct Author- J F M A M J J A
ity (FSCA). The portfolio is valued and
returns are measured in rands. PORTFOLIO ALLOCATION
December 2024 June 2024
DETAILS as at 31 December 2024 Sector
All fees and charges include Vat Value (Rmil) % of Fund Value (Rmil) % of Fund Difference
US Real Estate 115 70.30% 104 61.90% 8.40%
Formation date: 3 Oct 2000 UK Real Estate 19 11.40% 31 18.40% -7.00%
Min lump sum: R500 Canadian Real Estate 0 0.00% 7 3.90% -3.90%
Minimum monthly: R300 Far Eastern Real Estate 14 8 8.60% 18 3 10.60% -2.00%
Int Money Market
4.80%
2.90%
1.90%
Top-up investment: R300 RSA Money Market 8 4.90% 5 3.30% 1.60%
No of holdings: 1 TOTAL 163 100.00% 168 100.00% -2.98%
No of unitholders: 477 TOP HOLDINGS BY VALUE
Original price: 200 December 2024 June 2024
Broker p.a. com (A): 0.58% Short Name/ Units Value %of Units Value %of
Annual fee (A): 1% JSE Code Sector Name (000’s) (R ‘000) Fund (000’s) (R ‘000) Fund Difference
O-MARREAL Offshore 7 256 154 834 95.04% 7 565 159 840 95.34% (308 825)
TER (A) 12/24: 1.48% TOTAL 154 834 95.04% 159 840 95.34%
TER Perf% (A): 0.00%
Annual fee (C): 1% Price History Relative Strength to MSCI World index
TER (C) 12/24: 1.24% 700 1.5
TER Perf% (C): 0.00% 630 1.3
Fund value: R162.26m
560 1.1
Risk rating: Medium - High
PlexCrowns: 490 0.9
Income declaration: 31/03, 30/06, 420 0.7
30/09, 31/12 350 0.5
Income payment: 03/04, 03/07, 15 | 16 | 17 | 18 | 19 | 20 | 21 | 22 | 23 | 24 15 | 16 | 17 | 18 | 19 | 20 | 21 | 22 | 23 | 24
03/10, 03/01
Profile’s Unit Trusts & Collective Investments — DOMESTIC 279