
Page 284 - Profile's Unit Trusts & Collective Investments - March 2025
P. 284
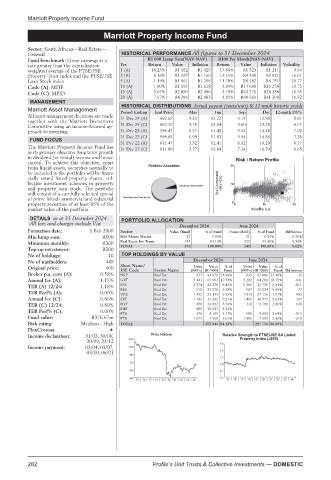
Marriott Property Income Fund

                               Marriott Property Income Fund
         Marriott Property Income Fund
         Sector: South African—Real Estate—
         General                    HISTORICAL PERFORMANCE All figures to 31 December 2024
         Fund benchmark: Grow earnings at a  R1 000 Lump Sum(NAV-NAV)  R100 Per Month(NAV-NAV)
         rate greater than the capitalisation  Yrs  Return  Value  Inflation  Return  Value  Inflation  Volatility
         weighted average of the FTSE/JSE  1 (A)  18.23%  R1 182  R1 029  17.84%  R1 323  R1 211  9.84
         Property Trust index and the FTSE/JSE  3 (A)  6.16%  R1 197  R1 160  13.11%  R4 430  R3 821  16.01
         Loan Stock index          5 (A)     1.19%  R1 061  R1 266  11.70%  R8 182  R6 751  26.77
         Code (A): MPIF            10 (A)    1.80%  R1 195  R1 618  3.89%  R14 688  R15 258  19.75
                                   15 (A)    5.07%  R2 099  R2 086  3.79%  R24 271  R26 338  16.95
         Code (C): MPID
                                   20 (A)    7.67%  R4 386  R2 883  4.85%  R40 561  R41 309  16.52
          MANAGEMENT
                                    HISTORICAL DISTRIBUTIONS Actual payout (cents/unit) & 12-mnth historic yields
         Marriott Asset Management  Period Ending  End Price  Mar  Jun  Sep  Dec  12-mnth DY%
         All asset management decisions are made  31 Dec 24 (A)  662.62  4.33  12.22  9.14  12.80  5.81
         together with the Marriott Investment
         Committee using an income-focused ap-  31 Dec 24 (C)  663.10  4.75  12.64  9.60  13.28  6.07
         proach to investing.      31 Dec 23 (A)  598.47  6.57  11.42  9.54  14.48   7.02
                                   31 Dec 23 (C)  598.85  6.99  11.83  9.94  14.86   7.28
          FUND FOCUS
                                   31 Dec 22 (A)  611.47  3.32  12.41  6.92  16.29   6.37
         The Marriott Property Income Fund has  31 Dec 22 (C)  611.88  3.77  12.84  7.34  16.70  6.65
         as its primary objective long term growth
         in dividend (or rental) income and hence                   Risk / Return Profile
         capital. To achieve this objective, apart
         from liquid assets, securities normally to                25
         be included in the portfolio will be finan-
         cially sound listed property shares, col-
         lective investment schemes in property                3yr Compound  return(%)  12
         and property loan stock. The portfolio
         will consist of a carefully selected spread
         of prime listed commercial and industrial
         property securities of at least 85% of the                0 0      10      20
         market value of the portfolio.                                 Volatility p.a.
          DETAILS as at 31 December 2024  PORTFOLIO ALLOCATION
          All fees and charges include Vat
                                                    December 2024    June 2024
         Formation date:   1 Feb 2000  Sector    Value (Rmil)  % of Fund  Value (Rmil)  % of Fund  Difference
         Min lump sum:        R500  RSA Money Market  22     5.90%     21   6.20%   -0.30%
         Minimum monthly:     R300  Real Estate Inv Trusts  354  94.10%  322  93.80%  0.30%
         Top-up investment:   R300  TOTAL            376    100.00%   343  100.00%  9.62%
         No of holdings:        10  TOP HOLDINGS BY VALUE
         No of unitholders:    449                      December 2024   June 2024
                                   Short Name/
                                                                      Units
                                                                           Value
                                                                               %of
                                                        Units
                                                            Value
                                                                 %of
         Original price:       400  JSE Code  Sector Name  (000’s) (R ‘000)  Fund  (000’s) (R ‘000)  Fund Difference
         Broker p.a. com (A):  0.58%  NRP    Real Est    677  93 979 24.99%  635  82 886 24.18%  42
         Annual fee (A):      1.15%  GRT     Real Est   5 141  65 903 17.53%  5 282  64 281 18.75%  -141
         TER (A) 12/24:       1.18%  SSS     Real Est   2 274  35 376  9.41%  2 385  33 730  9.84%  -111
                                   RES       Real Est    610  35 278  9.38%  687  32 534  9.49%  -77
         TER Perf% (A):       0.00%  VKE     Real Est   1 992  35 143  9.35%  1 810  27 121  7.91%  182
         Annual fee (C):      0.86%  SRE     Real Est   1 742  31 992  8.51%  1 445  30 972  9.03%  297
         TER (C) 12/24:       0.89%  HYP     Real Est    450  20 892  5.56%  314  9 789  2.86%  136
         TER Perf% (C):       0.00%  PHP     Real Est    889  19 647  5.23%
                                   FTA       Real Est    470  8 165  2.17%  585  9 054  2.64%  -115
         Fund value:       R376.67m  FTB     Real Est   1 577  7 568  2.01%  1 895  7 391  2.16%  -318
         Risk rating:   Medium - High  TOTAL               353 944 94.13%  297 758 86.86%
         PlexCrowns:
         Income declaration:  31/03, 30/06,  Price History      Relative Strength to FTSE/JSE SA Listed
                          30/09, 31/12  1200                         Property Index (J253)
                                                                1.5
         Income payment:  03/04, 03/07,  1040
                          03/10, 06/01                          1.3
                                      880
                                                                1.1
                                      720
                                                                0.9
                                      560                       0.7
                                      400                       0.5
                                        15 | 16 | 17 | 18 | 19 | 20 | 21 | 22 | 23 | 24  15 | 16 | 17 | 18 | 19 | 20 | 21 | 22 | 23 | 24
         282                                Profile’s Unit Trusts & Collective Investments — DOMESTIC