
Page 287 - Profile's Unit Trusts & Collective Investments - March 2025
P. 287
Mazi Asset Management Prime Africa Equity Fund
Mazi Asset Management Prime Africa Equity Fund
Mazi Asset Management Prime Africa Equity Fund
Sector: Global—Equity—Africa
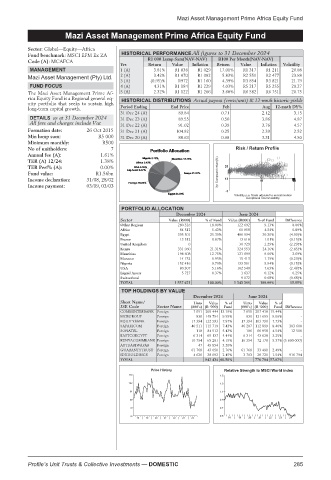
Fund benchmark: MSCI EFM Ex ZA HISTORICAL PERFORMANCE All figures to 31 December 2024
Code (A): MCAFCA R1 000 Lump Sum(NAV-NAV) R100 Per Month(NAV-NAV)
Yrs Return Value Inflation Return Value Inflation Volatility
MANAGEMENT 1 (A) 3.81% R1 038 R1 029 17.01% R1 317 R1 211 20.88
2 (A) 3.42% R1 070 R1 082 5.83% R2 551 R2 477 23.88
Mazi Asset Management (Pty) Ltd.
3 (A) (0.95)% R972 R1 160 4.39% R3 854 R3 821 21.79
FUND FOCUS 4 (A) 4.31% R1 184 R1 229 4.03% R5 217 R5 255 20.27
The Mazi Asset Management Prime Af- 5 (A) 2.32% R1 122 R1 266 3.60% R6 582 R6 751 20.75
rica Equity Fund is a Regional general eq- HISTORICAL DISTRIBUTIONS Actual payout (cents/unit) & 12-mnth historic yields
uity portfolio that seeks to sustain high
long-term capital growth. Period Ending End Price Feb Aug 12-mnth DY%
31 Dec 24 (A) 89.84 0.71 2.12 3.15
DETAILS as at 31 December 2024 31 Dec 23 (A) 89.55 0.50 3.86 4.87
All fees and charges include Vat
31 Dec 22 (A) 91.02 0.39 3.76 4.57
Formation date: 26 Oct 2015 31 Dec 21 (A) 104.92 0.25 2.39 2.52
Min lump sum: R5 000 31 Dec 20 (A) 88.63 0.68 3.31 4.50
Minimum monthly: R500
No of unitholders: 7 Risk / Return Profile
Annual fee (A): 1.61%
TER (A) 12/24: 1.38%
TER Perf% (A): 0.00% 25
Fund value: R1.56bn 3yr Compound return(%)
Income declaration: 31/08, 28/02 12 11 22
Income payment: 03/09, 03/03
-1
Volatility p.a. Scale adjusted to accommodate
exceptional return/volatility.
PORTFOLIO ALLOCATION
December 2024 June 2024
Sector Value (R000) % of Fund Value (R000) % of Fund Difference
Other Regions 280 326 18.00% 122 692 9.13% 8.86%
Africa 84 512 5.43% 60 958 4.54% 0.89%
Egypt 395 501 25.39% 406 994 30.30% (4.90)%
France 13 512 0.87% 13 610 1.01% (0.15)%
United Kingdom 0 30 729 2.29% (2.29)%
Kenya 331 960 21.31% 324 553 24.16% (2.85)%
Mauritius 198 608 12.75% 121 699 9.06% 3.69%
Morocco 14 752 0.95% 15 413 1.15% (0.20)%
Nigeria 152 416 9.79% 133 501 9.94% (0.15)%
USA 80 307 5.16% 102 540 7.63% (2.48)%
Liquid Assets 5 727 0.37% 1 637 0.12% 0.25%
Switzerland 9 072 0.68% (0.68)%
TOTAL 1 557 621 100.00% 1 343 399 100.00% 15.95%
TOP HOLDINGS BY VALUE
December 2024 June 2024
Short Name/ Units Value %of Units Value %of
JSE Code Sector Name (000’s) (R ‘000) Fund (000’s) (R ‘000) Fund Difference
COMMINTERBANK Foreign 7 051 205 444 13.19% 7 051 207 418 15.44% -
MCBGROUP Foreign 830 148 754 9.55% 830 121 699 9.06% -
EQUITYBANK Foreign 17 394 122 593 7.87% 17 394 103 790 7.73% -
SAFARICOM Foreign 46 511 115 719 7.43% 46 207 112 899 8.40% 303 600
SONATEL Foreign 118 84 512 5.43% 106 60 958 4.54% 12 500
EASTCOEGYPT Foreign 6 314 69 137 4.44% 6 314 43 628 3.25% -
KENYACOMMBANK Foreign 10 754 65 281 4.19% 16 354 72 178 5.37% (5 600 000)
ATTIJARIWAFAB Foreign 47 49 854 3.20%
GUARANTYTRUST Foreign 61 768 43 050 2.76% 61 768 33 491 2.49% -
IDHHOLDINGS Foreign 4 620 38 092 2.45% 3 703 20 720 1.54% 916 794
TOTAL 942 434 60.50% 776 784 57.82%
Price History Relative Strength to MSCI World index
110
1.5
102 1.3
94 1.1
86 0.9
78 0.7
70 0.5
18 | 19 | 20 | 21 | 22 | 23 | 24 18 | 19 | 20 | 21 | 22 | 23 | 24
Profile’s Unit Trusts & Collective Investments — DOMESTIC 285