
Page 288 - Profile's Unit Trusts & Collective Investments - March 2025
P. 288
Mazi Asset Management Prime Equity Fund
Mazi Asset Management Prime Equity Fund
Mazi Asset Management Prime Equity Fund
Sector: South African—Equity—General
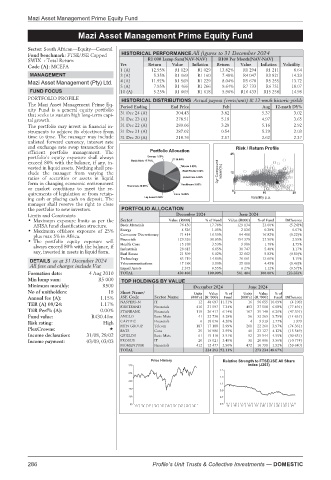
Fund benchmark: FTSE/JSE Capped HISTORICAL PERFORMANCE All figures to 31 December 2024
SWIX - Total Return R1 000 Lump Sum(NAV-NAV) R100 Per Month(NAV-NAV)
Code (A): MCEFA Yrs Return Value Inflation Return Value Inflation Volatility
1 (A) 12.95% R1 129 R1 029 13.82% R1 294 R1 211 8.64
MANAGEMENT 3 (A) 5.35% R1 169 R1 160 7.48% R4 047 R3 821 14.33
Mazi Asset Management (Pty) Ltd. 4 (A) 11.92% R1 569 R1 229 8.04% R5 678 R5 255 13.72
5 (A) 7.95% R1 466 R1 266 9.64% R7 733 R6 751 18.07
FUND FOCUS 10 (A) 5.25% R1 669 R1 618 5.96% R16 433 R15 258 14.98
PORTFOLIO PROFILE HISTORICAL DISTRIBUTIONS Actual payout (cents/unit) & 12-mnth historic yields
The Mazi Asset Management Prime Eq- Period Ending End Price Feb Aug 12-mnth DY%
uity Fund is a general equity portfolio
that seeks to sustain high long-term capi- 31 Dec 24 (A) 304.43 3.82 5.37 3.02
tal growth. 31 Dec 23 (A) 278.51 5.18 4.97 3.65
The portfolio may invest in financial in- 31 Dec 22 (A) 289.06 3.28 5.16 2.92
struments to achieve its objectives from 31 Dec 21 (A) 287.02 0.54 5.29 2.03
time to time. The manager may include 31 Dec 20 (A) 218.76 2.57 2.62 2.37
unlisted forward currency, interest rate
and exchange rate swap transactions for Risk / Return Profile
efficient portfolio management. The
portfolio’s equity exposure shall always 25
exceed 80% with the balance, if any, in-
vested in liquid assets. Nothing shall pre-
clude the manager from varying the 3yr Compound return(%) 12
ratios of securities or assets in liquid
form in changing economic environment
or market conditions to meet the re-
quirements of legislation or from retain- 0 0 10 20
ing cash or placing cash on deposit. The Volatility p.a.
manager shall reserve the right to close
the portfolio to new investors. PORTFOLIO ALLOCATION
Limits and Constraints December 2024 June 2024
• Maximum exposure limits as per the Sector Value (R000) % of Fund Value (R000) % of Fund Difference
ASISA fund classification structure. Basic Materials 76 450 17.76% 129 134 23.00% (5.24)%
• Maximum offshore exposure of 25% Energy 4 526 1.05% 2 136 0.38% 0.67%
plus max 5% in Africa. Consumer Discretionary 71 414 16.59% 94 408 16.82% (0.22)%
• The portfolio equity exposure will Financials 129 326 30.05% 154 379 27.50% 2.55%
always exceed 80% with the balance, if Health Care 15 188 3.53% 9 986 1.78% 1.75%
1.17%
any, invested in assets in liquid form. Industrials 28 613 6.65% 30 747 5.48% (0.80)%
21 599
32 662
5.82%
5.02%
Real Estate
DETAILS as at 31 December 2024 Technology 63 719 14.80% 76 661 13.66% 1.15%
All fees and charges include Vat Telecommunications 17 188 3.99% 25 008 4.45% (0.46)%
Liquid Assets 2 375 0.55% 6 276 1.12% (0.57)%
Formation date: 4 Aug 2010 TOTAL 430 406 100.00% 561 404 100.00% (23.33)%
Min lump sum: R5 000
TOP HOLDINGS BY VALUE
Minimum monthly: R500 December 2024 June 2024
No of unitholders: 18 Short Name/ Units Value %of Units Value %of
Annual fee (A): 1.15% JSE Code Sector Name (000’s) (R ‘000) Fund (000’s) (R ‘000) Fund Difference
TER (A) 09/24: 1.17% NASPERS-N IT 12 48 697 11.31% 16 56 655 10.09% (4 198)
FIRSTRAND Financials 416 31 597 7.34% 493 37 508 6.68% (77 491)
TER Perf% (A): 0.00% STANBANK Financials 119 26 417 6.14% 167 35 148 6.26% (47 391)
Fund value: R430.41m ANGLO Basic Mats 41 22 730 5.28% 56 32 269 5.75% (14 631)
Risk rating: High CAPITEC Financials 6 18 076 4.20% 4 9 919 1.77% 1 979
PlexCrowns: MTN GROUP Telcom 187 17 188 3.99% 261 22 260 3.97% (74 361)
25
16 980
Cons
(15 549)
3.95%
23 127
4.12%
40
BATS
Income declaration: 31/08, 28/02 GFIELDS Basic Mats 61 15 110 3.51% 92 25 544 4.55% (30 651)
Income payment: 03/09, 03/03 PROSUS IT 20 15 021 3.49% 31 20 006 3.56% (10 774)
MOMENTUM Financials 412 12 477 2.90% 472 10 798 1.92% (59 640)
TOTAL 224 293 52.11% 273 234 48.67%
Price History Relative Strength to FTSE/JSE All Share
320 index (J203)
1.5
274
1.3
228
1.1
182
0.9
136 0.7
90 0.5
15 | 16 | 17 | 18 | 19 | 20 | 21 | 22 | 23 | 24 15 | 16 | 17 | 18 | 19 | 20 | 21 | 22 | 23 | 24
286 Profile’s Unit Trusts & Collective Investments — DOMESTIC