
Page 285 - Profile's Unit Trusts & Collective Investments - March 2025
P. 285
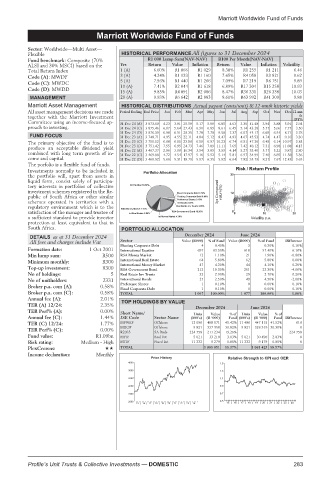
Marriott Worldwide Fund of Funds

                            Marriott Worldwide Fund of Funds
         Marriott Worldwide Fund of Funds
         Sector: Worldwide—Multi Asset—
         Flexible                   HISTORICAL PERFORMANCE All figures to 31 December 2024
         Fund benchmark: Composite (70%    R1 000 Lump Sum(NAV-NAV)  R100 Per Month(NAV-NAV)
         ALSI and 30% MSCI) based on the  Yrs  Return  Value  Inflation  Return  Value  Inflation  Volatility
         Total Return Index        1 (A)     6.60%  R1 066  R1 029  8.30%  R1 255  R1 211  6.46
         Code (A): MWDF            3 (A)     4.24%  R1 133  R1 160  7.65%  R4 058  R3 821  9.62
                                   5 (A)     7.56%  R1 440  R1 266  7.09%  R7 219  R6 751  9.89
         Code (C): MWDC
                                   10 (A)    7.41%  R2 044  R1 618  6.89%  R17 304  R15 258  10.93
         Code (D): MWDD
                                   15 (A)    9.85%  R4 091  R2 086  8.47%  R36 331  R26 338  10.03
          MANAGEMENT               20 (A)    9.93%  R6 642  R2 883  8.61%  R63 992  R41 309  9.88
         Marriott Asset Management  HISTORICAL DISTRIBUTIONS Actual payout (cents/unit) & 12-mnth historic yields
         All asset management decisions are made  Period Ending End Price  Jan  Feb  Mar  Apr  May  Jun  Jul  Aug  Sep  Oct  Nov  Dec 12-mn
         together with the Marriott Investment                                        th
         Committee using an income-focused ap-  31 Dec 24 (A) 3 873.60  4.23  3.91 25.59  5.17  5.09  6.85  4.63  3.30 41.48  3.94  3.88  5.91  DY%
                                                                                     2.94
         proach to investing.      31 Dec 24 (C) 3 875.46  6.07  5.64 27.43  6.91  6.89  8.61  6.45  5.14 43.28  5.77  5.66  7.77  3.50
                                   31 Dec 24 (D) 3 876.39  6.98  6.51 28.35  7.78  7.78  9.50  7.37  6.07 44.17  6.69  6.54  8.71  3.78
          FUND FOCUS               31 Dec 23 (A) 3 748.71  4.95  4.55 22.11  4.84  5.12  8.47  4.93  4.67 45.53  4.74  4.47  9.16  3.30
         The primary objective of the fund is to  31 Dec 23 (C) 3 750.52  6.68  6.15 23.86  6.59  6.97 10.23  6.74  6.51 47.26  6.45  6.14 10.97  3.85
         produce an acceptable dividend yield  31 Dec 23 (D) 3 751.42  7.55  6.95 24.73  7.46  7.89 11.11  7.65  7.42 48.12  7.31  6.98 11.88  4.13
         combined with long term growth of in-  31 Dec 22 (A) 3 467.37  2.96  3.00 16.34  3.54  3.85  3.59  4.14  5.27 33.40  5.77  5.22  9.87  2.80
                                                            5.52
                                                         5.16
                                               4.72
                                                   4.54 17.97
                                                                  5.81
                                   31 Dec 22 (C) 3 469.08
                                                               5.14
                                                                     6.97 34.99
                                                                                     3.36
                                                                               6.85 11.58
                                                                            7.40
         come and capital.         31 Dec 22 (D) 3 469.92  5.60  5.31 18.79  5.97  6.35  5.92  6.64  7.82 35.79  8.21  7.67 12.43  3.65
         The porfolio is a flexible fund of funds.
         Investments normally to be included in                     Risk / Return Profile
         the portfolio will, apart from assets in                  25
         liquid form, consist solely of participa-
         tory interests in portfolios of collective
         investment schemes registered in the Re-              3yr Compound  return(%)  12
         public of South Africa or other similar
         schemes operated in territories with a
         regulatory environment which is to the
         satisfaction of the manager and trustee of                0 0      10      20
         a sufficient standard to provide investor                      Volatility p.a.
         protection at least equivalent to that in
         South Africa.              PORTFOLIO ALLOCATION
          DETAILS as at 31 December 2024             December 2024   June 2024
          All fees and charges include Vat  Sector   Value (R000)  % of Fund  Value (R000)  % of Fund  Difference
                                   Floating Corporate Debt  4  0.40%    3   0.30%   0.10%
         Formation date:  1 Oct 2001  International Equities  697  63.50%  618  57.40%  6.10%
         Min lump sum:        R500  RSA Money Market      12  1.10%    21   1.90%   -0.80%
         Minimum monthly:     R300  InternationalRealEstate  64  5.80%  62  5.80%   0.00%
                                   International Money Market  47  4.30%  44  4.10%  0.20%
         Top-up investment:   R300  RSA Government Bond  212  19.30%  251   23.30%  -4.00%
         No of holdings:         5  Real Estate Inv Trusts  32  2.90%  29   2.70%   0.20%
         No of unitholders:   2331  International Bonds   27  2.50%    49   4.50%   -2.00%
         Broker p.a. com (A):  0.58%  Preference Shares   1   0.10%     0   0.00%   0.10%
                                   Fixed Corporate Debt   1   0.10%     0   0.00%   0.10%
         Broker p.a. com (C):  0.58%  TOTAL             1 097  100.00%  1 077  100.00%  1.86%
         Annual fee (A):      2.01%  TOP HOLDINGS BY VALUE
         TER (A) 12/24:       2.35%                      December 2024  June 2024
         TER Perf% (A):       0.00%
                                   Short Name/          Units  Value  %of  Units  Value  %of
         Annual fee (C):      1.44%  JSE Code  Sector Name  (000’s)  (R ‘000)  Fund (000’s)  (R ‘000)  Fund Difference
         TER (C) 12/24:       1.77%  MFWEF   Offshore  12 096  498 171  45.42% 11 480  447 115 41.52%  616
                                                        9 821
         TER Perf% (C):       0.00%  MIIGF   Offshore  224 758  337 958  30.82%  9 821  326 319 30.30%  224 758 0
                                   R2035
                                             SA Bnds
                                                            211 234
                                                                 19.26%
         Fund value:        R1.09bn  MPIF    Real Est   5 021  33 210  3.03%  5 021  30 496  2.83%  0
         Risk rating:   Medium - High  MTIF  Fixed Int  11 332  9 279  0.85% 11 332  9 179  0.85%  0
         PlexCrowns:               TOTAL                   1 089 851  99.37%  1 061 425 98.57%
         Income declaration:  Monthly
                                            Price History         Relative Strength to CPI excl OER
                                      4000                      1.5
                                      3600                      1.3
                                      3200                      1.1
                                      2800                      0.9
                                      2400                      0.7
                                      2000                      0.5
                                        15 | 16 | 17 | 18 | 19 | 20 | 21 | 22 | 23 | 24  15 | 16 | 17 | 18 | 19 | 20 | 21 | 22 | 23 | 24
         Profile’s Unit Trusts & Collective Investments — DOMESTIC                   283