
Page 283 - Profile's Unit Trusts & Collective Investments - March 2025
P. 283
Marriott Property Equity Fund
Marriott Property Equity Fund
Marriott Property Equity Fund
Sector: South African—Multi Asset—
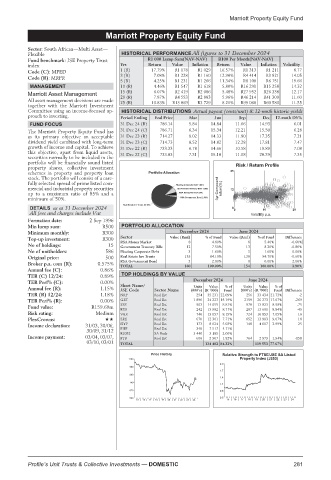
Flexible HISTORICAL PERFORMANCE All figures to 31 December 2024
Fund benchmark: JSE Property Trust R1 000 Lump Sum(NAV-NAV) R100 Per Month(NAV-NAV)
index Yrs Return Value Inflation Return Value Inflation Volatility
Code (C): MPED 1 (R) 17.79% R1 178 R1 029 16.57% R1 313 R1 211 8.77
Code (R): MRPR 3 (R) 7.08% R1 228 R1 160 12.90% R4 414 R3 821 14.05
5 (R) 4.25% R1 231 R1 266 11.34% R8 100 R6 751 19.66
MANAGEMENT 10 (R) 4.46% R1 547 R1 618 5.80% R16 291 R15 258 14.32
15 (R) 6.07% R2 419 R2 086 5.48% R27 952 R26 338 12.17
Marriott Asset Management 20 (R) 7.87% R4 553 R2 883 5.96% R46 214 R41 309 11.60
All asset management decisions are made 25 (R) 10.83% R13 069 R3 729 8.21% R99 068 R60 580 11.55
together with the Marriott Investment
Committee using an income-focused ap- HISTORICAL DISTRIBUTIONS Actual payout (cents/unit) & 12-mnth historic yields
proach to investing. Period Ending End Price Mar Jun Sep Dec 12-mnth DY%
FUND FOCUS 31 Dec 24 (R) 786.14 5.84 14.84 11.66 14.93 6.01
The Marriott Property Equity Fund has 31 Dec 24 (C) 786.71 6.34 15.34 12.21 15.50 6.28
as its primary objective an acceptable 31 Dec 23 (R) 714.27 8.02 14.33 11.80 17.35 7.21
dividend yield combined with long-term 31 Dec 23 (C) 714.73 8.52 14.82 12.28 17.81 7.47
growth of income and capital. To achieve 31 Dec 22 (R) 733.33 6.78 14.66 10.58 19.89 7.08
this objective, apart from liquid assets, 31 Dec 22 (C) 733.83 7.31 15.18 11.08 20.39 7.35
securities normally to be included in the
portfolio will be financially sound listed
property shares, collective investment Risk / Return Profile
schemes in property and property loan 25
stock. The portfolio will consist of a care-
fully selected spread of prime listed com-
mercial and industrial property securities 3yr Compound return(%) 12
up to a maximum ratio of 85% and a
minimum of 50%.
DETAILS as at 31 December 2024 0 0 10 20
All fees and charges include Vat Volatility p.a.
Formation date: 2 Sep 1996
Min lump sum: R500 PORTFOLIO ALLOCATION
Minimum monthly: R300 December 2024 June 2024
Sector Value (Rmil) % of Fund Value (Rmil) % of Fund Difference
Top-up investment: R300
No of holdings: 15 RSA Money Market 12 8 4.80% 13 8 5.40% -0.60%
-0.80%
8.30%
Government Treasury Bills
7.50%
No of unitholders: 586 Floating Corporate Debt 3 1.60% 3 1.60% 0.00%
Original price: 500 Real Estate Inv Trusts 135 84.10% 130 84.70% -0.60%
RSA Government Bond 3 2.00% 0 0.00% 2.00%
Broker p.a. com (R): 0.575% TOTAL 160 100.00% 154 100.00% 3.90%
Annual fee (C): 0.86%
TER (C) 12/24: 0.89% TOP HOLDINGS BY VALUE
TER Perf% (C): 0.00% December 2024 June 2024
Short Name/
Units
Value
%of
Value
%of
Units
Annual fee (R): 1.15% JSE Code Sector Name (000’s) (R ‘000) Fund (000’s) (R ‘000) Fund Difference
TER (R) 12/24: 1.18% NRP Real Est 254 35 231 22.09% 256 33 434 21.73% -2
TER Perf% (R): 0.00% GRT Real Est 1 890 24 223 15.19% 2159 26 273 17.07% -269
Fund value: R159.69m SSS Real Est 903 14 055 8.81% 978 13 823 8.98% -75
13 982
242
Real Est
287
8.84%
RES
8.77%
13 601
-45
Risk rating: Medium VKE Real Est 740 13 057 8.19% 724 10 853 7.05% 16
PlexCrowns: SRE Real Est 670 12 301 7.71% 652 13 983 9.07% 18
Income declaration: 31/03, 30/06, HYP Real Est 173 8 024 5.03% 148 4 607 2.99% 25
30/09, 31/12 PHP Real Est 340 7 517 4.71%
R2032 SA Bnds 3 440 3 185 2.00%
Income payment: 03/04, 03/07, FTB Real Est 606 2 907 1.82% 764 2 979 1.94% -158
03/10, 03/01 TOTAL 134 482 84.32% 119 553 77.67%
Price History Relative Strength to FTSE/JSE SA Listed
1100 Property Index (J253)
2.0
980
1.7
860
1.4
740
1.1
620 0.8
500 0.5
15 | 16 | 17 | 18 | 19 | 20 | 21 | 22 | 23 | 24 15 | 16 | 17 | 18 | 19 | 20 | 21 | 22 | 23 | 24
Profile’s Unit Trusts & Collective Investments — DOMESTIC 281