
Page 278 - Profile's Unit Trusts & Collective Investments - March 2025
P. 278
Marriott High Income Fund of Funds
Marriott High Income Fund of Funds
Marriott High Income Fund of Funds
Sector: South African—Multi Asset—
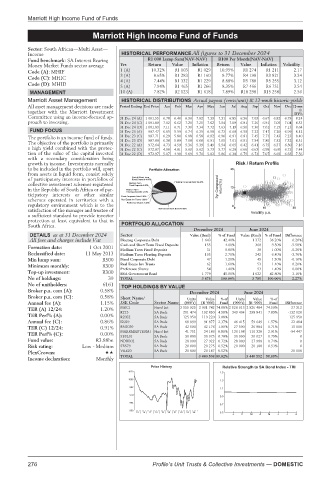
Income HISTORICAL PERFORMANCE All figures to 31 December 2024
Fund benchmark: SA Interest Bearing R1 000 Lump Sum(NAV-NAV) R100 Per Month(NAV-NAV)
Money Market Funds sector average Yrs Return Value Inflation Return Value Inflation Volatility
Code (A): MHIF 1 (A) 10.32% R1 103 R1 029 10.95% R1 274 R1 211 2.17
Code (C): MHIC 3 (A) 8.65% R1 283 R1 160 9.77% R4 198 R3 821 3.34
3.12
R1 332
8.88%
R5 780
R5 255
7.44%
R1 229
4 (A)
Code (D): MHID 5 (A) 7.94% R1 465 R1 266 8.35% R7 466 R6 751 3.54
MANAGEMENT 10 (A) 7.82% R2 123 R1 618 7.89% R18 298 R15 258 2.56
Marriott Asset Management HISTORICAL DISTRIBUTIONS Actual payout (cents/unit) & 12-mnth historic yields
All asset management decisions are made Period Ending End Price Jan Feb Mar Apr May Jun Jul Aug Sep Oct Nov Dec 12-mn
th
together with the Marriott Investment DY%
Committee using an income-focused ap- 31 Dec 24 (A) 1 001.55 6.78 6.40 6.96 7.02 7.39 7.31 6.85 6.56 7.03 6.67 6.82 6.79 8.24
proach to investing. 31 Dec 24 (C) 1 001.80 7.02 6.62 7.20 7.25 7.62 7.54 7.09 6.81 7.26 6.91 7.05 7.04 8.53
31 Dec 24 (D) 1 001.89 7.11 6.71 7.30 7.34 7.72 7.63 7.19 6.90 7.36 7.01 7.15 7.13 8.64
FUND FOCUS 31 Dec 23 (A) 987.47 6.05 5.59 6.74 6.35 6.58 6.73 6.68 6.58 7.22 7.47 7.20 6.99 8.12
The portfolio is an income fund of funds. 31 Dec 23 (C) 987.71 6.29 5.80 6.98 6.58 6.82 6.96 6.91 6.81 7.45 7.71 7.43 7.23 8.40
The objective of the portfolio is primarily 31 Dec 23 (D) 987.80 6.38 5.89 7.08 6.68 6.91 7.05 7.01 6.91 7.54 7.80 7.52 7.32 8.51
7.16
972.64
6.50
6.05
6.75
6.41
6.42
31 Dec 22 (A)
5.39
5.36
5.49
6.37
5.54
4.73
4.59
a high yield combined with the protec- 31 Dec 22 (C) 972.87 4.98 4.81 5.60 5.62 5.73 5.77 6.28 6.66 6.63 6.98 6.60 6.73 7.44
tion of the value of the capital invested 31 Dec 22 (D) 972.97 5.07 4.90 5.69 5.71 5.82 5.86 6.38 6.75 6.73 7.07 6.69 6.83 7.56
with a secondary consideration being
growth in income. Investments normally Risk / Return Profile
to be included in the portfolio will, apart 25
from assets in liquid form, consist solely
of participatory interests in portfolios of
collective investment schemes registered 3yr Compound return(%)
in the Republic of South Africa or of par- 12
ticipatory interests or other similar
schemes operated in territories with a
regulatory environment which is to the 0
10
satisfaction of the manager and trustee of 0 Volatility p.a. 20
a sufficient standard to provide investor
protection at least equivalent to that in
South Africa. PORTFOLIO ALLOCATION
December 2024 June 2024
DETAILS as at 31 December 2024 Sector Value (Rmil) % of Fund Value (Rmil) % of Fund Difference
All fees and charges include Vat Floating Corporate Debt 1 643 42.40% 1 372 36.20% 6.20%
Cash and Short Term Fixed Deposits 155 4.00% 360 9.50% -5.50%
Formation date: 1 Oct 2001 Medium Term Fixed Deposits 31 0.80% 38 1.00% -0.20%
Reclassified date: 11 May 2013 Medium Term Floating Deposits 105 2.70% 242 6.40% -3.70%
Min lump sum: R500 Fixed Corporate Debt 47 1.20% 49 1.30% -0.10%
Minimum monthly: R300 Real Estate Inv Trusts 62 1.60% 53 1.40% 0.20%
Preference Shares 54 1.40% 53 1.40% 0.00%
Top-up investment: R300 RSA Government Bond 1 779 45.90% 1 622 42.80% 3.10%
No of holdings: 39 TOTAL 3 875 100.00% 3 789 100.00% 2.27%
No of unitholders: 6161 TOP HOLDINGS BY VALUE
Broker p.a. com (A): 0.58% December 2024 June 2024
Broker p.a. com (C): 0.58% Short Name/ Units Value %of Units Value %of
Annual fee (A): 1.15% JSE Code Sector Name (000’s) (R ‘000) Fund (000’s) (R ‘000) Fund Difference
27 312
TER (A) 12/24: 1.20% MRCI Fixed Int 2 555 925 2 901 742 74.88% 2 528 613 2 826 484 74.59% -132 020
R213
192 850
4.98%
7.89%
298 841
343 494
211 474
SA Bnds
TER Perf% (A): 0.00% R2032 SA Bnds 125 950 119 220 3.08% 125 950
Annual fee (C): 0.86% I2029 SA Bnds 68 899 91 877 2.37% 46 415 59 649 1.57% 22 484
TER (C) 12/24: 0.91% RN2030 SA Bnds 42 500 42 176 1.09% 27 500 26 984 0.71% 15 000
MARRMEDTERMI Fixed Int 41 751 34 186 0.88% 136 198 110 320 2.91% -94 447
TER Perf% (C): 0.00% SBSL01 SA Bnds 30 000 30 073 0.78% 30 000 30 027 0.79% 0
Fund value: R3.88bn NDBB02 SA Bnds 28 000 27 922 0.72% 28 000 27 988 0.74% 0
Risk rating: Low - Medium SBS79 SA Bnds 20 000 20 275 0.52% 20 000 20 188 0.53% 0
PlexCrowns: VKE20 SA Bnds 20 000 20 187 0.52% 20 000
Income declaration: Monthly TOTAL 3 480 508 89.82% 3 440 592 90.80%
Price History Relative Strength to SA Bond Index - TRI
1020 1.5
1006 1.3
992
1.1
978
0.9
964
0.7
950
15 | 16 | 17 | 18 | 19 | 20 | 21 | 22 | 23 | 24 0.5
J F M A M J J A
276 Profile’s Unit Trusts & Collective Investments — DOMESTIC