
Page 274 - Profile's Unit Trusts & Collective Investments - March 2025
P. 274
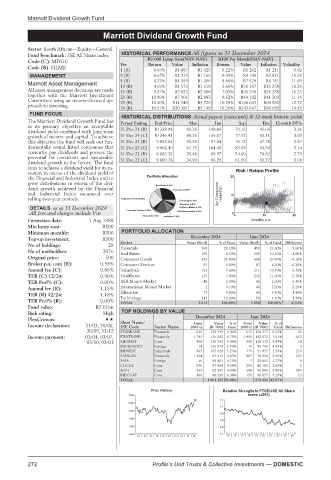
Marriott Dividend Growth Fund

                              Marriott Dividend Growth Fund
         Marriott Dividend Growth Fund
         Sector: South African—Equity—General
         Fund benchmark: JSE All Share index  HISTORICAL PERFORMANCE All figures to 31 December 2024
         Code (C): MDGC                    R1 000 Lump Sum(NAV-NAV)  R100 Per Month(NAV-NAV)
                                   Yrs     Return  Value  Inflation  Return  Value  Inflation  Volatility
         Code (R): HLMK
                                   1 (R)     8.66%  R1 087  R1 029  9.22%  R1 262  R1 211  6.82
          MANAGEMENT               3 (R)     6.67%  R1 214  R1 160  9.04%  R4 149  R3 821  10.62
                                   5 (R)     6.32%  R1 359  R1 266  8.86%  R7 570  R6 751  11.69
         Marriott Asset Management
                                   10 (R)    4.66%  R1 576  R1 618  5.66%  R16 167  R15 258  10.26
         All asset management decisions are made  15 (R)  9.37%  R3 832  R2 086  7.03%  R31 978  R26 338  10.25
         together with the Marriott Investment  20 (R)  10.89%  R7 901  R2 883  8.62%  R64 102  R41 309  11.16
         Committee using an income-focused ap-  25 (R)  10.20%  R11 348  R3 729  10.29%  R140 643  R60 580  12.72
         proach to investing.
                                   30 (R)   10.57%  R20 381  R5 148  10.31%  R243 647  R86 685  14.45
          FUND FOCUS
                                    HISTORICAL DISTRIBUTIONS Actual payout (cents/unit) & 12-mnth historic yields
         The Marriott Dividend Growth Fund has  Period Ending  End Price  Mar  Jun  Sep  Dec  12-mnth DY%
         as its primary objective an acceptable
         dividend yield combined with long term  31 Dec 24 (R)  10 338.98  81.26  149.86  70.15  45.66  3.36
         growth of income and capital. To achieve  31 Dec 24 (C)  10 346.43  88.26  156.67  77.52  53.11  3.63
         this objective the fund will seek out fun-  31 Dec 23 (R)  9 855.64  61.20  97.64  76.12  47.78  2.87
         damentally sound listed companies that  31 Dec 23 (C)  9 862.40  67.75  104.40  83.05  54.54  3.14
         currently pay dividends and possess the  31 Dec 22 (R)  8 883.33  28.48  89.97  54.69  74.82  2.79
         potential for consistent and sustainable  31 Dec 22 (C)  8 889.78  34.89  96.29  61.09  81.27  3.08
         dividend growth in the future. The fund
         aims to achieve a dividend yield for its in-
         vestors in excess of the dividend yield of                 Risk / Return Profile
         the Financial and Industrial Index and to                 25
         grow distributions in excess of the divi-
         dend growth achieved by the Financial
         and Industrial Index measured over                    3yr Compound  return(%)  12
         rolling two-year periods.
          DETAILS as at 31 December 2024
          All fees and charges include Vat                         0 0      10      20
         Formation date:  1 Aug 1988                                    Volatility p.a.
         Min lump sum:        R500
         Minimum monthly:     R300  PORTFOLIO ALLOCATION
                                                       December 2024    June 2024
         Top-up investment:   R300
         No of holdings:        29  Sector            Value (Rmil)  % of Fund  Value (Rmil)  % of Fund  Difference
                                   Financials
                                                                                    5.60%
         No of unitholders:   3976  Real Estate           568    28.20%  458  22.60%  -1.90%
                                                                              10.10%
                                                                         205
                                                                 8.20%
                                                          165
         Original price:       500  Consumer Goods        520    25.80%  606  29.90%  -4.10%
         Broker p.a. com (R):  0.58%  Consumer Services    81    4.00%    87  4.30%  -0.30%
         Annual fee (C):      0.86%  Industrials          153    7.60%   211  10.40%  3.40%
         TER (C) 12/24:       0.90%  Healthcare           159    7.90%   235  11.60%  -3.70%
         TER Perf% (C):       0.00%  RSA Money Market      48    2.40%    40  2.00%  0.40%
         Annual fee (R):      1.15%  International Money Market  2  0.10%  46  2.30%  -2.20%
                                   Education               77    3.80%    49  2.40%  1.40%
         TER (R) 12/24:       1.18%  Technology
                                                                          89
                                                                              4.40%
                                                          242
                                                                                    1.40%
                                                                 12.00%
         TER Perf% (R):       0.00%  TOTAL               2 015  100.00%  2 026  100.00%  -0.54%
         Fund value:        R2.01bn
         Risk rating:         High  TOP HOLDINGS BY VALUE
                                                         December 2024  June 2024
         PlexCrowns:               Short Name/
                                                                           Value
                                                                      Units
                                                                  %of
                                                              Value
                                                        Units
                                                                               %of
         Income declaration:  31/03, 30/06,  JSE Code  Sector Name  (000’s)  (R ‘000)  Fund  (000’s) (R ‘000)  Fund Difference
                          30/09, 31/12  STANBANK  Financials  626  138 949  6.90%  675 140 277  6.92%  -50
         Income payment:  03/04, 03/07,  FIRSTRAND  Financials  1 783  136 042  6.75%  1 896 142 072  7.01%  -112
                          03/10, 03/01  SHOPRIT  Cons    408  120 792  5.99%  390 110 173  5.44%  18
                                   MICROSOFT  Foreign    14  116 574  5.79%  11  89 799  4.43%  3
                                   BIDVEST   Industrials  395  105 428  5.23%  179  51 857  2.56%  216
                                   SANLAM    Financials  1 124  97 415  4.83%  987  78 924  3.90%  137
                                   VISA      Foreign     16  95 401  4.73%  7  35 802  1.77%  9
                                   CLICKS    Cons        235  87 899  4.36%  238  80 185  3.96%  -3
                                   A-V-I     Cons        763  82 355  4.09%  598  56 885  2.80%  165
                                   BIDCORP   Cons        186  80 298  3.98%  199  86 657  4.28%  -13
                                   TOTAL                    1 061 153 52.66%  872 631 43.07%
                                            Price History       Relative Strength to FTSE/JSE All Share
                                     11000                              index (J203)
                                                                1.2
                                     10000
                                                                1.1
                                      9000
                                                                0.9
                                      8000
                                                                0.8
                                      7000                      0.6
                                      6000                      0.5
                                        15 | 16 | 17 | 18 | 19 | 20 | 21 | 22 | 23 | 24  15 | 16 | 17 | 18 | 19 | 20 | 21 | 22 | 23 | 24
         272                                Profile’s Unit Trusts & Collective Investments — DOMESTIC