
Page 270 - Profile's Unit Trusts & Collective Investments - March 2025
P. 270
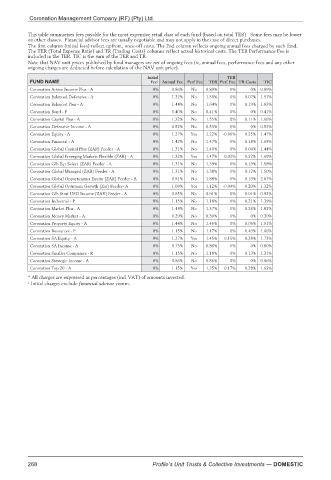
Coronation Management Company (RF) (Pty) Ltd.

         This table summarises fees payable for the most expensive retail class of each fund (based on total TER). Some fees may be lower
         on other classes. Financial advisor fees are usually negotiable and may not apply in the case of direct purchases.
         The first column (initial fees) reflect upfront, once-off costs. The 2nd column reflects ongoing annual fees charged by each fund.
         The TER (Total Expense Ratio) and TR (Trading Costs) columns reflect actual historical costs. The TER Performance Fee is
         included in the TER. TIC is the sum of the TER and TR.
         Note that NAV unit prices published by fund managers are net of ongoing fees (ie, annual fees, performance fees and any other
         ongoing charges are deducted before calculation of the NAV unit price).
                                           Initial                TER
          FUND NAME                         Fee 1 Annual Fee Perf Fee  TER Perf Fee TR Costs  TIC
          Coronation Active Income Plus - A  0%   0.86%  No  0.89%  0%  0%  0.89%
          Coronation Balanced Defensive - A  0%   1.32%  No  1.50%  0%  0.07%  1.57%
          Coronation Balanced Plus - A      0%    1.44%  No  1.64%  0%  0.19%  1.83%
          Coronation Bond - P               0%    0.40%  No  0.41%  0%  0%  0.41%
          Coronation Capital Plus - A       0%    1.32%  No  1.55%  0%  0.11%  1.66%
          Coronation Defensive Income - A   0%    0.52%  No  0.53%  0%  0%  0.53%
          Coronation Equity - A             0%    1.27%  Yes  1.22%  -0.06%  0.25%  1.47%
          Coronation Financial - A          0%    1.42%  No  1.47%  0%  0.18%  1.65%
          Coronation Global Capital Plus (ZAR) Feeder - A  0%  1.31%  No  1.40%  0%  0.04%  1.44%
          Coronation Global Emerging Markets Flexible (ZAR) - A  0%  1.32%  Yes  1.47%  0.02%  0.22%  1.69%
          Coronation Glb Eqt Select [ZAR] Feeder - A  0%  1.31%  No  1.39%  0%  0.19%  1.58%
          Coronation Global Managed (ZAR) Feeder - A  0%  1.31%  No  1.38%  0%  0.12%  1.50%
          Coronation Global Opportunities Equity [ZAR] Feeder - A  0%  0.91%  No  1.88%  0%  0.19%  2.07%
          Coronation Global Optimum Growth (Zar) Feeder- A  0%  1.08%  Yes  1.12%  -0.04%  0.20%  1.32%
          Coronation Glb Strat USD Income [ZAR] Feeder - A  0%  0.85%  No  0.91%  0%  0.01%  0.92%
          Coronation Industrial - P         0%    1.15%  No  1.18%  0%  0.21%  1.39%
          Coronation Market Plus - A        0%    1.44%  No  1.57%  0%  0.26%  1.83%
          Coronation Money Market - A       0%    0.29%  No  0.30%  0%  0%  0.30%
          Coronation Property Equity - A    0%    1.44%  No  1.46%  0%  0.05%  1.51%
          Coronation Resources - P          0%    1.15%  No  1.17%  0%  0.49%  1.66%
          Coronation SA Equity - A          0%    1.27%  Yes  1.45%  0.15%  0.28%  1.73%
          Coronation SA Income - A          0%    0.75%  No  0.80%  0%  0%  0.80%
          Coronation Smaller Companies - R  0%    1.15%  No  1.18%  0%  0.13%  1.31%
          Coronation Strategic Income - A   0%    0.86%  No  0.86%  0%  0%  0.86%
          Coronation Top 20 - A             0%    1.15%  Yes  1.35%  0.17%  0.28%  1.63%
         * All charges are expressed as percentages (incl VAT) of amounts invested.
         1 Initial charges exclude financial advisor comm.


         268                                Profile’s Unit Trusts & Collective Investments — DOMESTIC