
Page 268 - Profile's Unit Trusts & Collective Investments - March 2025
P. 268
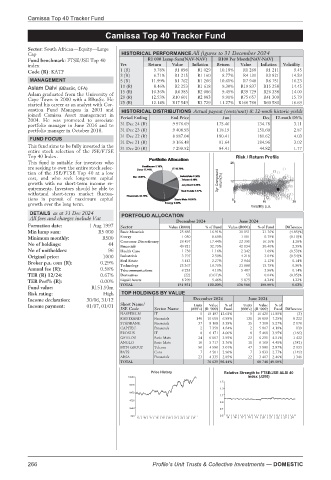
Camissa Top 40 Tracker Fund

                               Camissa Top 40 Tracker Fund
         Camissa Top 40 Tracker Fund
         Sector: South African—Equity—Large
         Cap                        HISTORICAL PERFORMANCE All figures to 31 December 2024
         Fund benchmark: FTSE/JSE Top 40   R1 000 Lump Sum(NAV-NAV)  R100 Per Month(NAV-NAV)
         index                     Yrs     Return  Value  Inflation  Return  Value  Inflation  Volatility
         Code (R): KATF            1 (R)     9.78%  R1 098  R1 029  10.18%  R1 268  R1 211  9.45
                                   3 (R)     6.71%  R1 215  R1 160  8.77%  R4 131  R3 821  14.59
          MANAGEMENT               5 (R)    11.99%  R1 762  R1 266  10.61%  R7 940  R6 751  16.23
                                   10 (R)    8.46%  R2 253  R1 618  9.30%  R19 837  R15 258  14.45
         Aslam Dalvi (BBusSc, CFA)  15 (R)  10.36%  R4 385  R2 086  9.45%  R39 729  R26 338  14.00
         Aslam graduated from the University of
         Cape Town in 2000 with a BBusSc. He  20 (R)  12.53%  R10 601  R2 883  9.91%  R75 657  R41 309  15.79
         started his career as an analyst with Cor-  25 (R)  12.14%  R17 549  R3 729  11.27%  R166 760  R60 580  16.69
         onation Fund Managers in 2001 and  HISTORICAL DISTRIBUTIONS Actual payout (cents/unit) & 12-mnth historic yields
         joined Camissa Asset management in  Period Ending  End Price  Jun  Dec  12-mnth DY%
         2004. He was promoted to associate
         portfolio manager in June 2016 and to  31 Dec 24 (R)  9 976.69  175.46  134.78  3.11
         portfolio manager in October 2018.  31 Dec 23 (R)  9 408.93  118.19  151.60  2.87
                                   31 Dec 22 (R)  8 987.04     180.41     181.62     4.03
          FUND FOCUS
                                   31 Dec 21 (R)  9 166.48     91.64      184.96     3.02
         This fund aims to be fully invested in the  31 Dec 20 (R)  7 299.52  84.41  44.82  1.77
         entire stock selection of the JSE/FTSE
         Top 40 Index.                                              Risk / Return Profile
         This fund is suitable for investors who                   25
         are seeking to own the entire stock selec-
         tion of the JSE/FTSE Top 40 at a low
         cost, and who seek long-term capital                  3yr Compound  return(%)
         growth with no short-term income re-                      12
         quirements. Investors should be able to
         withstand short-term market fluctua-
         tions in pursuit of maximum capital                       0
                                                                            10
         growth over the long term.                                0    Volatility p.a.  20
          DETAILS as at 31 Dec 2024  PORTFOLIO ALLOCATION
          All fees and charges include Vat
                                                   December 2024     June 2024
         Formation date:  1 Aug 1997  Sector     Value (R000)  % of Fund  Value (R000)  % of Fund  Difference
         Min lump sum:       R5 000  Basic Materials  25 685  16.91%  30 151  21.76%  (4.85)%
         Minimum monthly:     R500  Energy           1 050   0.69%    1 101  0.79%  (0.10)%
         No of holdings:        44  Consumer Discretionary  26 497  17.44%  22 395  16.16%  1.28%
                                   Financials       49 821   32.79%  42 134  30.40%  2.39%
         No of unitholders:     96  Health Care      1 758   1.16%    2 342  1.69%  (0.53)%
         Original price:      1000  Industrials      3 797   2.50%    4 218  3.04%  (0.54)%
                                                                            2.12%
                                                                      2 944
                                                     3 443
                                                             2.27%
         Broker p.a. com (R):  0.29%  Real Estate   25 367   16.70%  21 888  15.79%  0.14%
                                   Technology
                                                                                    0.90%
         Annual fee (R):      0.58%  Telecommunications  6 235  4.10%  5 487  3.96%  0.14%
         TER (R) 12/24:       0.67%  Derivatives     (22)   (0.01)%    53   0.04%  (0.05)%
         TER Perf% (R):       0.00%  Liquid Assets   8 299   5.46%    5 875  4.24%  1.22%
         Fund value:       R151.93m  TOTAL         151 931  100.00%  138 588  100.00%  9.63%
         Risk rating:         High  TOP HOLDINGS BY VALUE
         Income declaration:  30/06, 31/12              December 2024   June 2024
                                   Short Name/
         Income payment:  01/07, 01/01                  Units  Value  %of  Units  Value  %of
                                   JSE Code  Sector Name  (000’s) (R ‘000)  Fund  (000’s) (R ‘000)  Fund Difference
                                   NASPERS-N  IT          5  19 197 12.64%  5  16 420 11.85%  (3)
                                   FIRSTRAND  Financials  140  10 600  6.98%  131  10 099  7.29%  8 222
                                   STANBANK  Financials  37  8 168  5.38%  35  7 308  5.27%  2 170
                                   CAPITEC   Financials   2  7 359  4.84%  2  5 807  4.19%  139
                                   PROSUS    IT           8  6 171  4.06%  8  5 468  3.95%  (166)
                                   GFIELDS   Basic Mats  24  6 007  3.95%  23  6 255  4.51%  1 432
                                   ANGLO     Basic Mats  10  5 717  3.76%  11  6 169  4.45%  (342)
                                   MTN GROUP  Telcom     50  4 580  3.01%  47  3 980  2.87%  2 933
                                   BATS      Cons         7  4 501  2.96%  7  3 833  2.77%  (149)
                                   ABSA      Financials  23  4 335  2.85%  22  3 407  2.46%  1 346
                                   TOTAL                    76 635 50.44%  68 746 49.60%
                                            Price History        Relative Strength to FTSE/JSE ALSI 40
                                     10360                             index (J200)
                                                                1.5
                                      8416
                                                                1.3
                                      6472
                                                                1.1
                                      4528
                                                                0.9
                                      2584                      0.7
                                      640                       0.5  15 | 16 | 17 | 18 | 19 | 20 | 21 | 22 | 23 | 24
                                        15 | 16 | 17 | 18 | 19 | 20 | 21 | 22 | 23 | 24
         266                                Profile’s Unit Trusts & Collective Investments — DOMESTIC