
Page 264 - Profile's Unit Trusts & Collective Investments - March 2025
P. 264
Camissa Protector Fund
Camissa Protector Fund
Camissa Protector Fund
Sector: South African—Multi Asset—
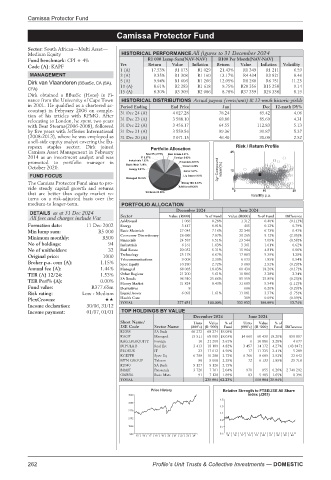
Medium Equity HISTORICAL PERFORMANCE All figures to 31 December 2024
Fund benchmark:CPI+4% R1 000 Lump Sum(NAV-NAV) R100 Per Month(NAV-NAV)
Code (A): KAPF Yrs Return Value Inflation Return Value Inflation Volatility
1 (A) 17.53% R1 175 R1 029 21.43% R1 349 R1 211 6.59
MANAGEMENT 3 (A) 9.35% R1 308 R1 160 13.17% R4 434 R3 821 8.46
5 (A) 9.94% R1 606 R1 266 12.05% R8 260 R6 751 11.25
Dirk van Vlaanderen (BBusSc, CA (SA),
10 (A) 8.61% R2 283 R1 618 9.75% R20 356 R15 258 9.14
CFA)
15 (A) 8.30% R3 309 R2 086 8.78% R37 359 R26 338 8.19
Dirk obtained a BBusSc (Hons) in Fi-
nance from the University of Cape Town HISTORICAL DISTRIBUTIONS Actual payout (cents/unit) & 12-mnth historic yields
in 2001. He qualified as a chartered ac- Period Ending End Price Jun Dec 12-mnth DY%
countant in February 2006 on comple- 31 Dec 24 (A) 4 027.28 78.24 85.42 4.06
tion of his articles with KPMG. After
relocating to London, he spent two years 31 Dec 23 (A) 3 588.10 68.80 85.69 4.31
with Bear Stearns(2006-2008), followed 31 Dec 22 (A) 3 456.17 64.55 112.83 5.13
by five years with Jefferies International 31 Dec 21 (A) 3 559.56 99.36 91.87 5.37
(2008-2013), where he was employed as 31 Dec 20 (A) 3 071.15 46.40 31.09 2.52
a sell-side equity analyst covering the Eu-
ropean staples sector. Dirk joined Risk / Return Profile
Camissa Asset Management in February 25
2014 as an investment analyst and was
promoted to portfolio manager in
October 2020. 3yr Compound return(%) 12
FUND FOCUS
The Camissa Protector Fund aims to pro-
vide steady capital growth and returns 0
10
that are better than equity market re- 0 Volatility p.a. 20
turns on a risk-adjusted basis over the
medium-to longer-term. PORTFOLIO ALLOCATION
DETAILS as at 31 Dec 2024 Sector December 2024 June 2024
All fees and charges include Vat Value (R000) % of Fund Value (R000) % of Fund Difference
Additional 1 066 0.28% 1 312 0.40% (0.11)%
Formation date: 11 Dec 2002 Energy 3 447 0.91% 405 0.12% 0.79%
Min lump sum: R5 000 Basic Materials 27 045 7.16% 22 340 6.73% 0.43%
Minimum monthly: R500 Consumer Discretionary 26 688 7.07% 30 265 9.12% (2.05)%
Financials 24 587 6.51% 23 544 7.09% (0.58)%
No of holdings: 94 Industrials 6 161 1.63% 3 361 1.01% 0.62%
No of unitholders: 32 Real Estate 20 052 5.31% 15 964 4.81% 0.50%
Original price: 1000 Technology 25 178 6.67% 17 883 5.39% 1.28%
9 008
2.39%
Telecommunications
1.85%
6 133
0.54%
Broker p.a. com (A): 1.15% Spec Equity 10 280 2.72% 9 689 2.92% (0.20)%
Annual fee (A): 1.44% Managed 68 085 18.03% 60 430 18.20% (0.17)%
TER (A) 12/24: 1.53% Other Regions 21 200 5.61% 10 886 3.28% 2.34%
TER Perf% (A): 0.00% SA Bonds 96 910 25.66% 85 959 25.89% (0.23)%
9.54%
(1.12)%
8.43%
31 689
31 824
Money Market
Fund value: R377.65m Derivatives 8 666 0.20% (0.20)%
Risk rating: Low - Medium Liquid Assets 6 093 1.61% 11 181 3.37% (1.75)%
PlexCrowns: Health Care 309 0.09% (0.09)%
Income declaration: 30/06, 31/12 TOTAL 377 651 100.00% 332 032 100.00% 13.74%
Income payment: 01/07, 01/01 TOP HOLDINGS BY VALUE
December 2024 June 2024
Short Name/ Units Value %of Units Value %of
JSE Code Sector Name (000’s) (R ‘000) Fund (000’s) (R ‘000) Fund Difference
R2038 SA Bnds 66 272 68 274 18.08%
KAGF Managed 15 511 68 085 18.03% 14 660 60 430 18.20% 850 897
KAGLBLEQUITY Foreign 10 21 200 5.61% 6 10 886 3.28% 4 677
DIPULA B Real Est 3 413 18 189 4.82% 3 457 14 172 4.27% (43 847)
PROSUS IT 23 17 012 4.50% 17 11 335 3.41% 5 289
KGEFFB Spec Eq 6 789 10 280 2.72% 6 766 9 689 2.92% 22 642
MTN GROUP Telcom 98 9 008 2.39% 72 6 133 1.85% 25 718
R2040 SA Bnds 9 127 8 126 2.15%
BRAIT Financials 3 720 7 701 2.04% 971 855 0.26% 2 749 292
OMNIA Basic Mats 91 7 128 1.89% 83 5 485 1.65% 8 396
TOTAL 235 004 62.23% 118 984 35.84%
Price History Relative Strength to FTSE/JSE All Share
4030 index (J203)
1.5
3404
1.3
2778
1.1
2152
0.9
1526 0.7
900 0.5
15 | 16 | 17 | 18 | 19 | 20 | 21 | 22 | 23 | 24 15 | 16 | 17 | 18 | 19 | 20 | 21 | 22 | 23 | 24
262 Profile’s Unit Trusts & Collective Investments — DOMESTIC