
Page 261 - Profile's Unit Trusts & Collective Investments - March 2025
P. 261
Camissa Islamic Equity Fund
Camissa Islamic Equity Fund
Camissa Islamic Equity Fund
Sector: South African—Equity—General
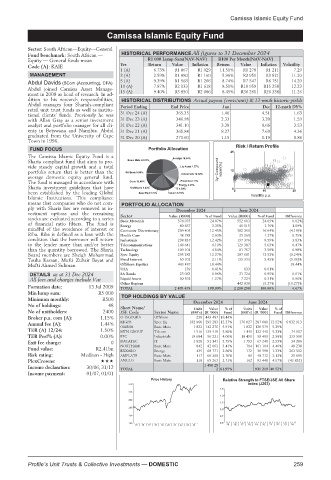
Fund benchmark: South African — HISTORICAL PERFORMANCE All figures to 31 December 2024
Equity — General funds mean R1 000 Lump Sum(NAV-NAV) R100 Per Month(NAV-NAV)
Code (A): KAIE Yrs Return Value Inflation Return Value Inflation Volatility
1 (A) 6.73% R1 067 R1 029 11.51% R1 278 R1 211 7.29
MANAGEMENT 3 (A) 2.59% R1 080 R1 160 5.96% R3 951 R3 821 11.20
5 (A) 9.39% R1 566 R1 266 8.74% R7 547 R6 751 14.20
Abdul Davids (BCom (Accounting), CFA)
Abdul joined Camissa Asset Manage- 10 (A) 7.87% R2 133 R1 618 8.51% R18 959 R15 258 12.23
R2 086
R36 261
R3 850
R26 338
8.45%
15 (A)
9.40%
11.26
ment in 2008 as head of research. In ad-
dition to his research responsibilities, HISTORICAL DISTRIBUTIONS Actual payout (cents/unit) & 12-mnth historic yields
Abdul manages four Shariah-compliant Period Ending End Price Jun Dec 12-mnth DY%
retail unit trust funds as well as institu-
tional clients’ funds. Previously he was 31 Dec 24 (A) 365.35 1.46 4.51 1.63
with Allan Gray as a senior investment 31 Dec 23 (A) 346.98 2.33 3.20 1.59
analyst and portfolio manager for all cli- 31 Dec 22 (A) 341.10 3.38 8.66 3.53
ents in Botswana and Namibia. Abdul 31 Dec 21 (A) 365.84 8.27 7.69 4.36
graduated from the University of Cape 31 Dec 20 (A) 273.60 1.15 1.19 0.86
Town in 1996.
Risk / Return Profile
FUND FOCUS
25
The Camissa Islamic Equity Fund is a
Sharia compliant fund that aims to pro-
vide steady capital growth and a total
portfolio return that is better than the 3yr Compound return(%) 12
average domestic equity general fund.
The fund is managed in accordance with
Sharia investment guidelines that have 0
been established by the leading Global 0 10 20
Islamic Institutions. This compliance Volatility p.a.
means that companies who do not com- PORTFOLIO ALLOCATION
ply with Sharia law are removed as in- December 2024 June 2024
vestment options and the remaining Sector
stocks are evaluated according to a series Basic Materials Value (R000) % of Fund Value (R000) % of Fund Difference
578 975
0.02%
552 663
24.07%
24.05%
of financial ratio filters. The fund is Energy 80 667 3.35% 40 515 1.76% 1.59%
mindful of the avoidance of interest or Consumer Discretionary 299 405 12.45% 382 356 16.64% (4.19)%
Riba. Riba is defined as a loan with the Health Care 48 783 2.03% 29 269 1.27% 0.75%
condition that the borrower will return Industrials 298 837 12.42% 197 376 8.59% 3.83%
to the lender more than and/or better Telecommunications 146 641 6.10% 129 387 5.63% 0.47%
than the quantity borrowed. The Sharia Technology 109 104 4.54% 81 757 3.56% 0.98%
Board members are Sheigh Mohammad Spec Equity 295 283 12.27% 287 681 12.52% (0.24)%
Tauha Karaan, Mufti Zubair Bayat and Fixed Interest 50 702 2.11% 125 333 5.45% (3.35)%
Mufti Ahmed Suliman. Offshore Equities 443 487 18.44% 18.44%
USA 139 0.01% 133 0.01% -
DETAILS as at 31 Dec 2024 SA Bonds 23 063 0.96% 21 724 0.95% 0.01%
All fees and charges include Vat Liquid Assets 30 592 1.27% 7 224 0.31% 0.96%
Other Regions 442 830 19.27% (19.27)%
Formation date: 13 Jul 2009 TOTAL 2 405 678 100.00% 2 298 298 100.00% 4.67%
Min lump sum: R5 000 TOP HOLDINGS BY VALUE
Minimum monthly: R500
December 2024 June 2024
No of holdings: 48
Short Name/ Units Value %of Units Value %of
No of unitholders: 2400 JSE Code Sector Name (000’s) (R ‘000) Fund (000’s) (R ‘000) Fund Difference
Broker p.a. com (A): 1.15% O-ISGEQKA Offshore 238 443 487 18.44%
Annual fee (A): 1.44% KIGFB Spec Eq 182 860 295 283 12.27% 176 027 287 681 12.52% 6 832 913
OMNIA Basic Mats 1 822 142 276 5.91% 1 822 120 579 5.25% -
TER (A) 12/24: 1.50% MTN GROUP Telcom 1 516 139 419 5.80% 1 441 122 440 5.33% 74 107
TER Perf% (A): 0.00% PPC Industrials 18 684 96 221 4.00% 18 450 59 409 2.58% 233 590
Exit fee charge: 0 DATATEC IT 1 828 91 141 3.79% 1 793 67 248 2.93% 34 286
48 238
Fund value: R2.41bn NORTHAM Basic Mats 842 82 063 3.41% 794 101 104 4.40% 263 502
172
EXXARO
30 598
2.86%
68 771
Energy
435
1.33%
Risk rating: Medium - High AMPLATS Basic Mats 117 66 368 2.76% 81 48 712 2.12% 35 695
PlexCrowns: ANGLO Basic Mats 118 65 263 2.71% 162 93 448 4.07% (43 832)
Income declaration: 30/06, 31/12 TOTAL 1 490 29 2 61.95% 931 219 40.52%
Income payment: 01/07, 01/01
Price History Relative Strength to FTSE/JSE All Share
370 index (J203)
1.5
316
1.3
262
1.1
208
0.9
154 0.7
100 0.5
15 | 16 | 17 | 18 | 19 | 20 | 21 | 22 | 23 | 24 15 | 16 | 17 | 18 | 19 | 20 | 21 | 22 | 23 | 24
Profile’s Unit Trusts & Collective Investments — DOMESTIC 259