
Page 258 - Profile's Unit Trusts & Collective Investments - March 2025
P. 258
Camissa Equity Alpha Fund
Camissa Equity Alpha Fund
Camissa Equity Alpha Fund
Sector: South African—Equity—General
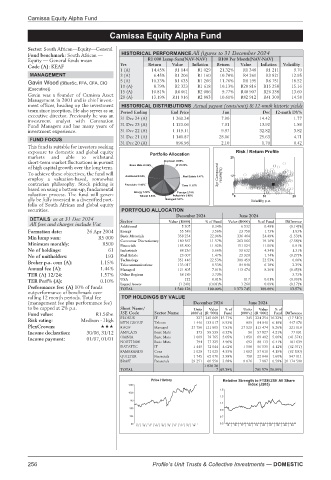
Fund benchmark: South African — HISTORICAL PERFORMANCE All figures to 31 December 2024
Equity — General funds mean R1 000 Lump Sum(NAV-NAV) R100 Per Month(NAV-NAV)
Code (A): KEAF Yrs Return Value Inflation Return Value Inflation Volatility
1 (A) 14.45% R1 144 R1 029 21.32% R1 348 R1 211 9.70
MANAGEMENT 3 (A) 6.45% R1 206 R1 160 10.70% R4 261 R3 821 12.95
5 (A) 10.33% R1 635 R1 266 11.76% R8 195 R6 751 18.52
Gavin Wood (BBusSc, FFA, CFA, CIO
10 (A) 8.79% R2 323 R1 618 10.13% R20 816 R15 258 15.16
(Executive))
15 (A) 10.81% R4 661 R2 086 9.77% R40 907 R26 338 13.60
Gavin was a founder of Camissa Asset 20 (A) 13.19% R11 916 R2 883 10.61% R82 912 R41 309 14.58
Management in 2001 and is chief invest-
ment officer, heading up the investment HISTORICAL DISTRIBUTIONS Actual payout (cents/unit) & 12-mnth historic yields
team since inception. He also serves as an Period Ending End Price Jun Dec 12-mnth DY%
executive director. Previously he was an 31 Dec 24 (A) 1 260.24 7.90 14.42 1.77
investment analyst with Coronation
Fund Managers and has many years of 31 Dec 23 (A) 1 123.06 7.01 13.92 1.86
investment experience. 31 Dec 22 (A) 1 119.11 9.97 32.82 3.82
31 Dec 21 (A) 1 140.87 28.06 25.63 4.71
FUND FOCUS
31 Dec 20 (A) 896.98 2.10 1.70 0.42
This fund is suitable for investors seeking
exposure to domestic and global equity Risk / Return Profile
markets and able to withstand 25
short-term market fluctuations in pursuit
of high capital growth over the long term.
To achieve these objectives, the fund will 3yr Compound return(%)
employ a valuation-based, somewhat 12
contrarian philosophy. Stock picking is
based on using a bottom-up, fundamental
valuation process. The fund will gener- 0 0 10 20
ally be fully invested in a diversified port- Volatility p.a.
folio of South African and global equity
securities. PORTFOLIO ALLOCATION
December 2024 June 2024
DETAILS as at 31 Dec 2024 Sector
All fees and charges include Vat Value (R000) % of Fund Value (R000) % of Fund Difference
Additional 5 307 0.34% 6 532 0.48% (0.14)%
Formation date: 26 Apr 2004 Energy 55 548 3.56% 23 758 1.73% 1.83%
Min lump sum: R5 000 Basic Materials 358 234 22.96% 336 464 24.49% (1.53)%
Consumer Discretionary 180 567 11.57% 263 166 19.16% (7.58)%
Minimum monthly: R500 Financials 185 890 11.92% 151 124 11.00% 0.91%
No of holdings: 61 Industrials 88 236 5.66% 59 632 4.34% 1.31%
No of unitholders: 193 Real Estate 23 007 1.47% 23 920 1.74% (0.27)%
Broker p.a. com (A): 1.15% Technology 351 446 22.53% 309 459 22.53% 0.00%
Telecommunications 133 017 8.53% 84 840 6.18% 2.35%
Annual fee (A): 1.44% Managed 121 805 7.81% 113 474 8.26% (0.45)%
TER (A) 12/24: 1.57% Other Regions 58 189 3.73% 3.73%
0.01%
117
122
TER Perf% (A): 0.10% USA (1 241) (0.08)% 1 260 0.01% (0.00)%
(0.17)%
0.09%
Liquid Assets
Performance fee: (A) 10% of funds TOTAL 1 560 128 100.00% 1 373 745 100.00% 13.57%
outperformance of benchmark over
rolling 12 month periods. Total fee TOP HOLDINGS BY VALUE
(management fee plus performance fee) December 2024 June 2024
to be capped at 2% p.a. Short Name/ Units Value %of Units Value %of
Fund value: R1.56bn JSE Code Sector Name (000’s) (R ‘000) Fund (000’s) (R ‘000) Fund Difference
Risk rating: Medium - High PROSUS IT 327 245 069 15.71% 345 224 254 16.32% (17 510)
MTN GROUP Telcom 1 446 133 017 8.53% 999 84 840 6.18% 447 170
PlexCrowns: KAGF Managed 27 750 121 805 7.81% 27 529 113 474 8.26% 221 010
Income declaration: 30/06, 31/12 AMPLATS Basic Mats 173 98 539 6.32% 96 57 827 4.21% 77 091
Income payment: 01/07, 01/01 OMNIA Basic Mats 1 009 78 765 5.05% 1 050 69 492 5.06% (41 374)
NORTHAM Basic Mats 794 77 325 4.96% 692 88 113 6.41% 101 639
DATATEC IT 1 445 72 044 4.62% 1 508 56 535 4.12% (62 971)
FAMBRANDS Cons 1 029 71 025 4.55% 1 092 57 010 4.15% (62 590)
QUILTER Financials 1 745 62 070 3.98% 798 22 046 1.60% 947 011
BRAIT Financials 29 251 60 550 3.88% 9 076 7 987 0.58% 20 174 590
1 020 20
TOTAL 7 65.39% 781 579 56.89%
Price History Relative Strength to FTSE/JSE All Share
1260 index (J203)
1.5
1026
1.3
792
1.1
558
0.9
324 0.7
90 0.5
15 | 16 | 17 | 18 | 19 | 20 | 21 | 22 | 23 | 24 15 | 16 | 17 | 18 | 19 | 20 | 21 | 22 | 23 | 24
256 Profile’s Unit Trusts & Collective Investments — DOMESTIC