
Page 257 - Profile's Unit Trusts & Collective Investments - March 2025
P. 257
Camissa Balanced Fund
Camissa Balanced Fund
Camissa Balanced Fund
Sector: South African—Multi Asset—
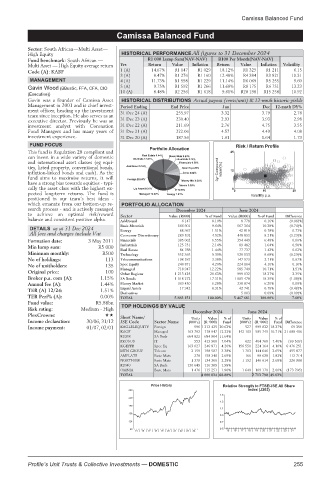
High Equity HISTORICAL PERFORMANCE All figures to 31 December 2024
Fund benchmark: South African — R1 000 Lump Sum(NAV-NAV) R100 Per Month(NAV-NAV)
Multi Asset — High Equity average return Yrs Return Value Inflation Return Value Inflation Volatility
Code (A): KABF 1 (A) 14.67% R1 147 R1 029 18.12% R1 325 R1 211 6.15
3 (A) 8.47% R1 276 R1 160 12.48% R4 384 R3 821 10.31
MANAGEMENT 4 (A) 11.73% R1 558 R1 229 11.14% R6 069 R5 255 9.60
5 (A) 9.75% R1 592 R1 266 11.68% R8 175 R6 751 13.23
Gavin Wood (BBusSc, FFA, CFA, CIO
10 (A) 8.48% R2 256 R1 618 9.61% R20 198 R15 258 10.92
(Executive))
Gavin was a founder of Camissa Asset HISTORICAL DISTRIBUTIONS Actual payout (cents/unit) & 12-mnth historic yields
Management in 2001 and is chief invest- Period Ending End Price Jun Dec 12-mnth DY%
ment officer, heading up the investment 31 Dec 24 (A) 255.97 3.32 3.79 2.78
team since inception. He also serves as an
executive director. Previously he was an 31 Dec 23 (A) 230.40 2.93 3.93 2.98
investment analyst with Coronation 31 Dec 22 (A) 211.69 2.76 4.75 3.55
Fund Managers and has many years of 31 Dec 21 (A) 222.06 4.57 4.49 4.08
investment experience. 31 Dec 20 (A) 187.56 1.61 1.64 1.73
FUND FOCUS Risk / Return Profile
This fund is Regulation 28 compliant and 25
can invest in a wide variety of domestic
and international asset classes (eg equi-
ties, listed property, conventional bonds, 3yr Compound return(%)
inflation-linked bonds and cash). As the 12
fund aims to maximise returns, it will
have a strong bias towards equities - typi-
cally the asset class with the highest ex- 0
10
pected long-term returns. The fund is 0 Volatility p.a. 20
positioned in our team’s best ideas -
which emanate from our bottom-up re- PORTFOLIO ALLOCATION
search process - and is actively managed December 2024 June 2024
to achieve an optimal risk/reward Sector Value (R000) % of Fund Value (R000) % of Fund Difference
balance and consistent positive alpha. Additional 6 147 0.10% 8 778 0.16% (0.06)%
DETAILS as at 31 Dec 2024 Basic Materials 566 901 9.64% 567 364 10.38% (0.74)%
0.78%
42 819
Energy
88 967
1.51%
0.73%
All fees and charges include Vat Consumer Discretionary 289 592 4.92% 448 833 8.21% (3.29)%
Formation date: 3 May 2011 Financials 385 062 6.55% 354 449 6.48% 0.06%
Min lump sum: R5 000 Industrials 125 751 2.14% 89 482 1.64% 0.50%
Real Estate
0.02%
1.42%
84 788
77 737
1.44%
Minimum monthly: R500 Technology 552 365 9.39% 529 133 9.68% (0.29)%
No of holdings: 113 Telecommunications 198 587 3.38% 147 973 2.71% 0.67%
No of unitholders: 135 Spec Equity 246 871 4.20% 224 164 4.10% 0.10%
718 947
Original price: 100 Managed 1 213 425 12.22% 585 749 10.71% 1.51%
20.63%
18.27%
2.35%
999 032
Other Regions
Broker p.a. com (A): 1.15% SA Bonds 1 018 272 17.31% 1 005 470 18.39% (1.08)%
Annual fee (A): 1.44% Money Market 369 450 6.28% 338 874 6.20% 0.08%
Liquid Assets 17 942 0.31% 42 741 0.78% (0.48)%
TER (A) 12/24: 1.51% Derivatives 5 003 0.09% (0.09)%
TER Perf% (A): 0.00% TOTAL 5 883 151 100.00% 5 467 681 100.00% 7.60%
Fund value: R5.88bn
TOP HOLDINGS BY VALUE
Risk rating: Medium - High
December 2024 June 2024
PlexCrowns: Short Name/
%of
Units
Value
Value
%of
Units
Income declaration: 30/06, 31/12 JSE Code Sector Name (000’s) (R ‘000) Fund (000’s) (R ‘000) Fund Difference
Income payment: 01/07, 02/01 KAGLBLEQUITY Foreign 596 1 213 425 20.63% 527 999 032 18.27% 69 350
KAGF Managed 163 792 718 947 12.22% 142 103 585 749 10.71% 21 688 406
R2038 SA Bnds 664 822 684 904 11.64%
PROSUS IT 553 413 900 7.04% 622 404 768 7.40% (69 569)
KGEFFB Spec Eq 163 027 246 871 4.20% 156 550 224 164 4.10% 6 476 251
MTN GROUP Telcom 2 159 198 587 3.38% 1 703 144 646 2.65% 455 877
AMPLATS Basic Mats 278 158 340 2.69% 166 99 638 1.82% 112 714
NORTHAM Basic Mats 1 379 134 300 2.28% 1 152 146 614 2.68% 226 988
R2040 SA Bnds 130 649 116 309 1.98%
OMNIA Basic Mats 1 476 115 251 1.96% 1 649 109 179 2.00% (173 796)
TOTAL 4 000 834 68.00% 2 713 790 49.63%
Price History Relative Strength to FTSE/JSE All Share
260 index (J203)
1.5
226
1.3
192
1.1
158
0.9
124 0.7
90 0.5
15 | 16 | 17 | 18 | 19 | 20 | 21 | 22 | 23 | 24 15 | 16 | 17 | 18 | 19 | 20 | 21 | 22 | 23 | 24
Profile’s Unit Trusts & Collective Investments — DOMESTIC 255