
Page 263 - Profile's Unit Trusts & Collective Investments - March 2025
P. 263
Camissa Islamic High Yield Fund
Camissa Islamic High Yield Fund
Camissa Islamic High Yield Fund
Sector: South African—Multi Asset—
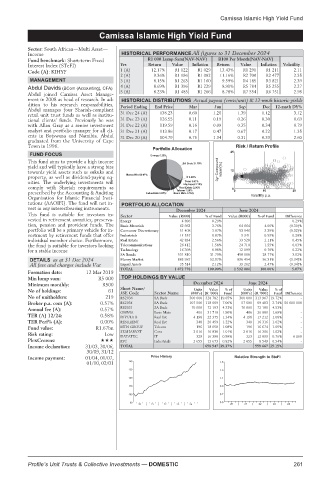
Income HISTORICAL PERFORMANCE All figures to 31 December 2024
Fund benchmark: Short-term Fixed R1 000 Lump Sum(NAV-NAV) R100 Per Month(NAV-NAV)
Interest Index (STeFI) Yrs Return Value Inflation Return Value Inflation Volatility
Code (A): KIHYF 1 (A) 12.17% R1 122 R1 029 13.43% R1 291 R1 211 2.11
2 (A) 9.36% R1 196 R1 082 11.16% R2 700 R2 477 2.35
MANAGEMENT 3 (A) 8.15% R1 265 R1 160 9.59% R4 185 R3 821 2.39
4 (A) 8.69% R1 396 R1 229 8.91% R5 784 R5 255 2.27
Abdul Davids (BCom (Accounting), CFA) 5 (A) 8.23% R1 485 R1 266 8.78% R7 554 R6 751 2.98
Abdul joined Camissa Asset Manage-
ment in 2008 as head of research. In ad- HISTORICAL DISTRIBUTIONS Actual payout (cents/unit) & 12-mnth historic yields
dition to his research responsibilities, Period Ending End Price Mar Jun Sep Dec 12-mnth DY%
Abdul manages four Shariah-compliant
retail unit trust funds as well as institu- 31 Dec 24 (A) 138.23 0.60 1.20 1.39 1.12 3.12
tional clients’ funds. Previously he was 31 Dec 23 (A) 126.55 0.11 0.19 0.26 0.30 0.69
with Allan Gray as a senior investment 31 Dec 22 (A) 119.59 0.16 0.09 0.35 0.34 0.79
analyst and portfolio manager for all cli- 31 Dec 21 (A) 113.86 0.17 0.47 0.67 0.22 1.35
ents in Botswana and Namibia. Abdul 31 Dec 20 (A) 104.79 0.75 1.34 0.31 0.33 2.60
graduated from the University of Cape
Town in 1996. Risk / Return Profile
25
FUND FOCUS
This fund aims to provide a high income
yield and will typically have a strong bias
towards yield assets such as sukuks and 3yr Compound return(%) 12
property, as well as dividend-paying eq-
uities. The underlying investments will
comply with Shariah requirements as 0
prescribed by the Accounting & Auditing 0 10 20
Organisation for Islamic Financial Insti- Volatility p.a.
tutions (AAOIFI). The fund will not in- PORTFOLIO ALLOCATION
vest in any interestbearing instruments.
December 2024 June 2024
This fund is suitable for investors in- Sector Value (R000) % of Fund Value (R000) % of Fund Difference
vested in retirement annuities, preserva- Energy 4 896 0.29% 0.29%
tion, pension and provident funds. The Basic Materials 62 963 3.76% 64 664 4.06% (0.30)%
portfolio will be a primary vehicle for in- Consumer Discretionary 51 408 3.07% 53 946 3.39% (0.32)%
vestment by retirement funds that offer Industrials 14 557 0.87% 9 341 0.59% 0.28%
individual member choice. Furthermore, Real Estate 42 834 2.56% 33 528 2.11% 0.45%
the fund is suitable for investors looking Telecommunications 26 412 1.58% 24 710 1.55% 0.03%
for a stable income Technology 16 398 0.98% 12 099 0.76% 0.22%
SA Bonds 531 810 31.79% 458 000 28.77% 3.02%
DETAILS as at 31 Dec 2024 Money Market 885 987 52.97% 896 454 56.31% (3.34)%
All fees and charges include Vat Liquid Assets 35 514 2.12% 39 262 2.47% (0.34)%
TOTAL 1 672 778 100.00% 1 592 006 100.00% 5.07%
Formation date: 12 Mar 2019
Min lump sum: R5 000 TOP HOLDINGS BY VALUE
Minimum monthly: R500 December 2024 June 2024
Units
Value
%of
Units
%of
Value
No of holdings: 61 Short Name/ Sector Name (000’s) (R ‘000) Fund (000’s) (R ‘000) Fund Difference
JSE Code
No of unitholders: 219 RS2036 SA Bnds 300 000 328 782 19.65% 300 000 313 967 19.72% -
Broker p.a. com (A): 0.57% RS2034 SA Bnds 107 500 118 059 7.06% 57 500 59 483 3.74% 50 000 000
Annual fee (A): 0.57% RS2031 SA Bnds 70 000 72 193 4.32% 70 000 72 180 4.53% -
OMNIA
Basic Mats
406
406
TER (A) 12/24: 0.58% DIPULA B Real Est 4 198 31 718 1.90% 4 198 26 881 1.69% - -
22 375
1.34%
1.08%
17 212
TER Perf% (A): 0.00% RESILIENT Real Est 348 20 459 1.22% 348 16 316 1.02% -
Fund value: R1.67bn MTN GROUP Telcom 196 18 058 1.08% 196 16 674 1.05% -
SEAHARVST Cons 2 016 16 830 1.01% 2 016 16 306 1.02% -
Risk rating: Low DATATEC IT 329 16 398 0.98% 323 12 099 0.76% 6 168
PlexCrowns: PPC Industrials 2 655 13 673 0.82% 2 655 8 549 0.54% -
Income declaration: 31/03, 30/06, TOTAL 658 547 39.37% 559 667 35.15%
30/09, 31/12
Income payment: 01/04, 01/07, Price History Relative Strength to SteFI
01/10, 02/01 140 1.5
130 1.3
120 1.1
110 0.9
100 0.7
90 0.5
20 | 21 | 22 | 23 | 24 20 | 21 | 22 | 23 | 24
Profile’s Unit Trusts & Collective Investments — DOMESTIC 261