
Page 265 - Profile's Unit Trusts & Collective Investments - March 2025
P. 265
Camissa SA Balanced Fund
Camissa SA Balanced Fund
Camissa SA Balanced Fund
Sector: South African—Multi Asset—
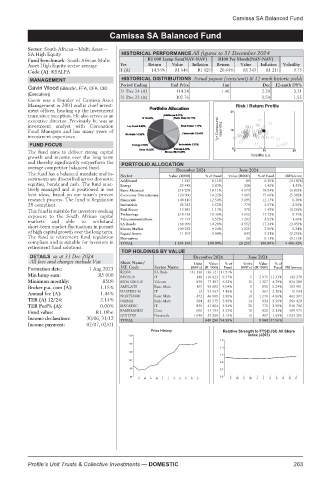
SA High Equity HISTORICAL PERFORMANCE All figures to 31 December 2024
Fund benchmark: South African Multi R1 000 Lump Sum(NAV-NAV) R100 Per Month(NAV-NAV)
Asset High Equity sector average Yrs Return Value Inflation Return Value Inflation Volatility
Code (A): KSALFA 1 (A) 14.56% R1 146 R1 029 20.64% R1 343 R1 211 9.75
MANAGEMENT HISTORICAL DISTRIBUTIONS Actual payout (cents/unit) & 12-mnth historic yields
Period Ending End Price Jun Dec 12-mnth DY%
Gavin Wood (BBusSc, FFA, CFA, CIO
31 Dec 24 (A) 114.24 1.46 2.20 3.21
(Executive)) 31 Dec 23 (A) 102.76 - 1.59 1.55
Gavin was a founder of Camissa Asset
Management in 2001 and is chief invest- Risk / Return Profile
ment officer, heading up the investment 31
team since inception. He also serves as an
executive director. Previously he was an
investment analyst with Coronation
Fund Managers and has many years of 1yr Compound return(%) 16
investment experience.
FUND FOCUS
0
The fund aims to deliver strong capital 0 10 20
growth and income over the long term Volatility p.a.
and thereby significantly outperform the PORTFOLIO ALLOCATION
average competitor balanced fund. December 2024 June 2024
The fund has a balanced mandate and in- Sector Value (R000) % of Fund Value (R000) % of Fund Difference
vestments are diversified across domestic Additional 1 343 0.11% 80 0.30% (0.19)%
equities, bonds and cash. The fund is ac- Energy 33 448 2.83% 368 1.40% 1.43%
tively managed and is positioned in our Basic Materials 214 298 18.11% 4 973 18.94% (0.83)%
best ideas, based on our team’s proven Consumer Discretionary 120 900 10.22% 4 095 15.60% (5.38)%
research process. The fund is Regulation Financials 148 410 12.54% 3 195 12.17% 0.38%
28 compliant. Industrials 65 342 5.52% 779 2.97% 2.56%
This fund is suitable for investors seeking Real Estate 13 881 1.17% 375 1.43% (0.26)%
exposure to the South African capital Technology 218 453 18.46% 4 652 17.72% 0.75%
markets and able to withstand Telecommunications 77 197 6.52% 1 292 4.92% 1.60%
short-term market fluctuations in pursuit SA Bonds 168 999 14.28% 4 552 17.34% (3.05)%
3.90%
9.24%
1 025
109 282
Money Market
5.34%
of high capital growth over the long term. Liquid Assets 11 597 0.98% 843 3.21% (2.23)%
The fund is retirement fund regulation Derivatives 28 0.11% (0.11)%
compliant and is suitable for investors in TOTAL 1 183 150 100.00% 26 255 100.00% 4 406.42%
retirement fund solutions.
TOP HOLDINGS BY VALUE
DETAILS as at 31 Dec 2024 December 2024 June 2024
All fees and charges include Vat Short Name/ Units Value %of Units Value %of
Formation date: 1 Aug 2023 JSE Code Sector Name (000’s) (R ‘000) Fund (000’s) (R ‘000) Fund Difference
R2038 SA Bnds 132 130 136 121 11.51%
Min lump sum: R5 000 PROSUS IT 148 110 823 9.37% 5 2 975 11.33% 143 378
Minimum monthly: R500 MTN GROUP Telcom 839 77 197 6.52% 15 1 257 4.79% 824 388
Broker p.a. com (A): 1.15% AMPLATS Basic Mats 105 59 662 5.04% 1 850 3.24% 103 451
Annual fee (A): 1.44% NASPERS-N IT 13 52 967 4.48% 0 564 2.15% 12 534
NORTHAM Basic Mats 472 46 009 3.89% 10 1 276 4.86% 462 307
TER (A) 12/24: 2.14% OMNIA Basic Mats 584 45 575 3.85% 14 934 3.56% 569 429
TER Perf% (A): 0.00% DATATEC IT 839 41 864 3.54% 21 775 2.95% 818 796
Fund value: R1.18bn FAMBRANDS Cons 606 41 794 3.53% 16 822 3.13% 589 973
3.15%
37 268
1.55%
407
Income declaration: 30/06, 31/12 QUILTER Financials 1 048 649 280 54.88% 15 9 860 37.56% 1 033 286
TOTAL
Income payment: 02/07, 02/01
Price History Relative Strength to FTSE/JSE All Share
120 index (J203)
1.5
114
1.3
108
1.1
102
0.9
96
0.7
90 0.5
F M A M J J A S O N D F M A M J J A S O N D
Profile’s Unit Trusts & Collective Investments — DOMESTIC 263