
Page 267 - Profile's Unit Trusts & Collective Investments - March 2025
P. 267
Camissa Stable Fund
Camissa Stable Fund
Camissa Stable Fund
Sector: South African—Multi Asset—
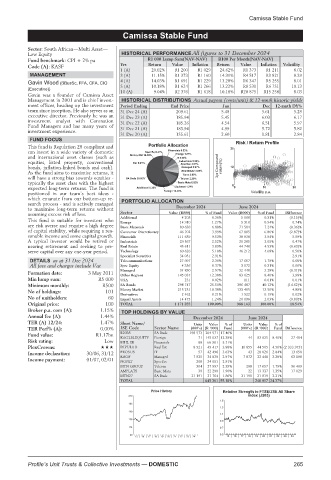
Low Equity HISTORICAL PERFORMANCE All figures to 31 December 2024
Fund benchmark:CPI+2%pa R1 000 Lump Sum(NAV-NAV) R100 Per Month(NAV-NAV)
Code (A): KASF Yrs Return Value Inflation Return Value Inflation Volatility
1 (A) 20.02% R1 200 R1 029 24.62% R1 373 R1 211 8.02
MANAGEMENT 3 (A) 11.15% R1 373 R1 160 14.31% R4 517 R3 821 8.39
4 (A) 14.03% R1 691 R1 229 13.20% R6 347 R5 255 8.01
Gavin Wood (BBusSc, FFA, CFA, CIO
5 (A) 10.18% R1 624 R1 266 13.22% R8 531 R6 751 10.13
(Executive))
10 (A) 9.04% R2 376 R1 618 10.18% R20 875 R15 258 8.03
Gavin was a founder of Camissa Asset
Management in 2001 and is chief invest- HISTORICAL DISTRIBUTIONS Actual payout (cents/unit) & 12-mnth historic yields
ment officer, heading up the investment Period Ending End Price Jun Dec 12-mnth DY%
team since inception. He also serves as an 31 Dec 24 (A) 209.61 5.48 5.61 5.29
executive director. Previously he was an 31 Dec 23 (A) 185.94 5.45 6.03 6.17
investment analyst with Coronation 31 Dec 22 (A) 185.26 4.54 6.51 5.97
Fund Managers and has many years of
investment experience. 31 Dec 21 (A) 183.94 4.99 5.72 5.82
31 Dec 20 (A) 155.61 2.60 1.81 2.84
FUND FOCUS
Risk / Return Profile
This fund is Regulation 28 compliant and 25
can invest in a wide variety of domestic
and international asset classes (such as
equities, listed property, conventional
bonds, inflation-linked bonds and cash). 3yr Compound return(%) 12
As the fund aims to maximise returns, it
will have a strong bias towards equities -
typically the asset class with the highest
expected long-term returns. The fund is 0 0 10 20
positioned in our team’s best ideas - Volatility p.a.
which emanate from our bottom-up re- PORTFOLIO ALLOCATION
search process - and is actively managed
to maximise long-term returns without December 2024 June 2024
assuming excess risk of loss. Sector Value (R000) % of Fund Value (R000) % of Fund Difference
4 205
This fund is suitable for investors who Additional 14 910 0.36% 5 068 0.51% (0.15)%
Energy
0.54%
0.74%
1.27%
5 310
are risk averse and require a high degree Basic Materials 80 638 6.88% 71 584 7.24% (0.36)%
of capital stability, while requiring a rea- Consumer Discretionary 46 702 3.99% 67 805 6.86% (2.87)%
sonable income and some capital growth. Financials 111 659 9.53% 38 938 3.94% 5.59%
A typical investor would be retired or Industrials 29 567 2.52% 20 285 2.05% 0.47%
nearing retirement and seeking to pre- Real Estate 45 611 3.89% 44 740 4.53% (0.63)%
serve capital over any one-year period. Technology 60 626 5.18% 46 212 4.68% 0.50%
Specialist Securities 34 051 2.91% 2.91%
DETAILS as at 31 Dec 2024 Telecommunications 27 997 2.39% 17 657 1.79% 0.60%
All fees and charges include Vat Spec Equity 4 356 0.37% 3 072 0.31% 0.06%
Managed 34 830 2.97% 32 448 3.28% (0.31)%
Formation date: 3 May 2011
Other Regions 145 037 12.38% 83 025 8.40% 3.98%
Min lump sum: R5 000 USA 231 0.02% 111 0.01% 0.01%
Minimum monthly: R500 SA Bonds 298 747 25.50% 396 487 40.12% (14.62)%
No of holdings: 101 Money Market 215 251 18.38% 133 405 13.50% 4.88%
Derivatives
0.21%
1 922
2 462
0.02%
0.19%
No of unitholders: 60 Liquid Assets 14 475 1.24% 20 096 2.03% (0.80)%
Original price: 100 TOTAL 1 171 355 100.00% 988 163 100.00% 18.54%
Broker p.a. com (A): 1.15% TOP HOLDINGS BY VALUE
Annual fee (A): 1.44% December 2024 June 2024
TER (A) 12/24: 1.47% Short Name/ Units Value %of Units Value %of
TER Perf% (A): 0.00% JSE Code Sector Name (000’s) (R ‘000) Fund (000’s) (R ‘000) Fund Difference
R2038 SA Bnds 198 573 204 571 17.46%
Fund value: R1.17bn KAGLBLEQUITY Foreign 71 145 037 12.38% 44 83 025 8.40% 27 484
Risk rating: Low BIHL EB Financials 88 66 901 5.71%
PlexCrowns: DIPULA B Real Est 8 521 45 417 3.88% 10 855 44 505 4.50% (2 333 973)
Income declaration: 30/06, 31/12 PROSUS IT 57 42 496 3.63% 43 28 026 2.84% 13 656
KAGF Managed 7 935 34 830 2.97% 7 872 32 448 3.28% 63 198
Income payment: 01/07, 02/01 NGPLT SpecSec 208 34 051 2.91%
MTN GROUP Telcom 304 27 997 2.39% 208 17 657 1.79% 96 469
AMPLATS Basic Mats 39 22 299 1.90% 22 13 337 1.35% 17 029
MTN27 SA Bnds 21 191 21 764 1.86% 21 191 21 819 2.21% -
TOTAL 645 361 55.10% 240 817 24.37%
Price History Relative Strength to FTSE/JSE All Share
210 index (J203)
1.5
186
1.3
162
1.1
138
0.9
114 0.7
90 0.5
15 | 16 | 17 | 18 | 19 | 20 | 21 | 22 | 23 | 24 15 | 16 | 17 | 18 | 19 | 20 | 21 | 22 | 23 | 24
Profile’s Unit Trusts & Collective Investments — DOMESTIC 265