
Page 273 - Profile's Unit Trusts & Collective Investments - March 2025
P. 273
Marriott Core Income Fund
Marriott Core Income Fund
Marriott Core Income Fund
Sector: South African—Multi Asset—
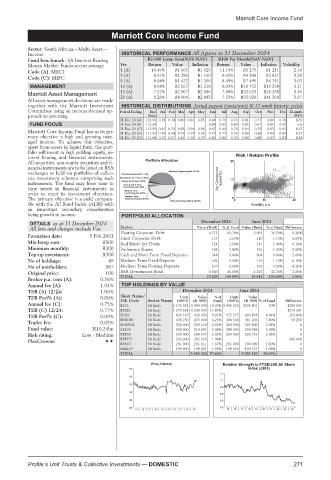
Income HISTORICAL PERFORMANCE All figures to 31 December 2024
Fund benchmark: SA Interest Bearing R1 000 Lump Sum(NAV-NAV) R100 Per Month(NAV-NAV)
Money Market Funds sector average Yrs Return Value Inflation Return Value Inflation Volatility
Code (A): MRCI 1 (A) 10.49% R1 105 R1 029 11.14% R1 275 R1 211 2.18
Code (C): MIFC 3 (A) 8.81% R1 288 R1 160 9.92% R4 208 R3 821 3.28
5 (A) 8.04% R1 472 R1 266 8.49% R7 495 R6 751 3.63
MANAGEMENT 10 (A) 8.04% R2 167 R1 618 8.03% R18 452 R15 258 3.31
15 (A) 7.52% R2 967 R2 086 7.60% R33 623 R26 338 3.46
Marriott Asset Management 20 (A) 8.28% R4 906 R2 883 7.53% R55 926 R41 309 3.97
All asset management decisions are made
together with the Marriott Investment HISTORICAL DISTRIBUTIONS Actual payout (cents/unit) & 12-mnth historic yields
Committee using an income-focused ap- Period Ending End Jan Feb Mar Apr May Jun Jul Aug Sep Oct Nov Dec 12-mnth
proach to investing. Price DY%
31 Dec 24 (A) 113.56 0.78 0.74 0.80 0.81 0.85 0.84 0.79 0.76 0.81 0.77 0.80 0.78 8.39
FUND FOCUS 31 Dec 24 (B) 113.60 0.88 0.83 0.80 0.85 0.81 0.85 0.82 n/a
31 Dec 24 (C) 113.59 0.81 0.76 0.83 0.84 0.88 0.87 0.81 0.78 0.84 0.79 0.83 0.81 8.67
Marriott Core Income Fund has as its pri- 31 Dec 23 (A) 111.95 0.70 0.64 0.79 0.73 0.76 0.77 0.77 0.76 0.83 0.86 0.84 0.80 8.27
mary objective a high and growing man- 31 Dec 23 (C) 111.98 0.73 0.67 0.81 0.76 0.79 0.80 0.80 0.79 0.86 0.88 0.87 0.83 8.55
aged income. To achieve this objective,
apart from assets in liquid form, the port-
folio will invest in high yielding equity, in-
terest bearing and financial instruments. Risk / Return Profile
All securities, non-equity securities and fi- 25
nancial instruments are to be listed on RSA
exchanges or held via portfolios of collec-
tive investment schemes comprising such 3yr Compound return(%) 12
instruments. The fund may from time to
time invest in financial instruments in
order to meet its investment objectives.
The primary objective is a yield compara- 0 0 10 20
ble with the All Bond Index (ALBI) with Volatility p.a.
an important secondary consideration
being growth in income. PORTFOLIO ALLOCATION
DETAILS as at 31 December 2024 December 2024 June 2024
All fees and charges include Vat Sector Value (Rmil) % of Fund Value (Rmil) % of Fund Difference
Floating Corporate Debt 4 372 42.70% 3 665 36.50% 6.20%
Formation date: 5 Feb 2001 Fixed Corporate Debt 113 1.10% 110 1.10% 0.00%
Min lump sum: R500 Real Estate Inv Trusts 154 1.50% 141 1.40% 0.10%
Minimum monthly: R300 Preference Shares 184 1.80% 161 1.60% 0.20%
Top-up investment: R300 Cash and Short Term Fixed Deposits 348 3.40% 904 9.00% -5.60%
No of holdings: 49 Medium Term Fixed Deposits 102 1.00% 110 1.10% -0.10%
No of unitholders: 987 Medium Term Floating Deposits 297 2.90% 703 7.00% -4.10%
Original price: 100 RSA Government Bond 4 669 45.60% 4 247 42.30% 3.30%
TOTAL 10 238 100.00% 10 041 100.00% 1.96%
Broker p.a. com (A): 0.58%
Annual fee (A): 1.04% TOP HOLDINGS BY VALUE
TER (A) 12/24: 1.06% December 2024 June 2024
TER Perf% (A): 0.00% Short Name/ Units Value %of Units Value
JSE Code Sector Name (000’s) (R ‘000) Fund (000’s) (R ‘000) % of Fund Difference
Annual fee (C): 0.75% R213 SA Bnds 2 176 625 1 984 939 19.39% 3 462 620 2932 801 30% -1285 995
TER (C) 12/24: 0.77% R2032 SA Bnds 1 276 561 1 208 343 11.80% 1276 561
TER Perf% (C): 0.00% I2029 SA Bnds 696 167 928 350 9.07% 472 277 603 848 6.04% 223 890
Trailer fee: 0.05% RN2030 SA Bnds 438 750 435 408 4.25% 388 500 381 208 3.80% 50 250 0
SA Bnds
304 000
304 000
303 154
2.96%
3.03%
NDBB02
303 869
Fund value: R10.24bn SBS79 SA Bnds 208 000 210 861 2.06% 208 000 209 958 2.09% 0
Risk rating: Low - Medium PEP06 SA Bnds 205 000 206 575 2.02% 205 000 206 319 2.05% 0
PlexCrowns: BPPF51 SA Bnds 203 000 202 935 1.98% 203 000
RES63 SA Bnds 201 000 201 911 1.97% 201 000 200 989 2.00% 0
MML07 SA Bnds 199 000 199 861 1.95% 199 000 199 137 1.98% 0
TOTAL 5 882 336 57.46% 5 038 129 50.99%
Price History Relative Strength to FTSE/JSE All Share
120 index (J203)
1.2
116
1.1
112
0.9
108
0.8
104 0.6
100 0.5
15 | 16 | 17 | 18 | 19 | 20 | 21 | 22 | 23 | 24 15 | 16 | 17 | 18 | 19 | 20 | 21 | 22 | 23 | 24
Profile’s Unit Trusts & Collective Investments — DOMESTIC 271