
Page 279 - Profile's Unit Trusts & Collective Investments - March 2025
P. 279
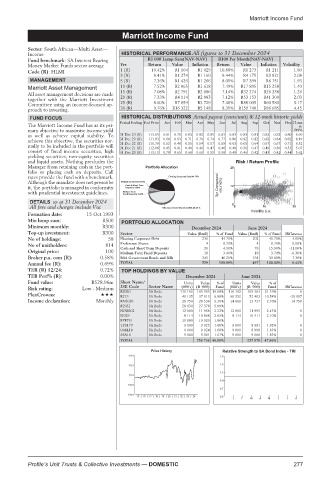
Marriott Income Fund

                                    Marriott Income Fund
         Marriott Income Fund
         Sector: South African—Multi Asset—
         Income                     HISTORICAL PERFORMANCE All figures to 31 December 2024
         Fund benchmark: SA Interest Bearing  R1 000 Lump Sum(NAV-NAV)  R100 Per Month(NAV-NAV)
         Money Market Funds sector average  Yrs  Return  Value  Inflation  Return  Value  Inflation  Volatility
         Code (R): HLMI            1 (R)    10.42%  R1 104  R1 029  10.88%  R1 273  R1 211  1.80
                                   3 (R)     8.41%  R1 274  R1 160  9.44%  R4 175  R3 821  2.08
          MANAGEMENT               5 (R)     7.36%  R1 426  R1 266  8.01%  R7 399  R6 751  1.93
         Marriott Asset Management  10 (R)   7.52%  R2 065  R1 618  7.49%  R17 895  R15 258  1.40
         All asset management decisions are made  15 (R)  7.08%  R2 791  R2 086  7.14%  R32 274  R26 338  1.26
         together with the Marriott Investment  20 (R)  7.33%  R4 114  R2 883  7.12%  R53 153  R41 309  2.03
         Committee using an income-focused ap-  25 (R)  8.60%  R7 859  R3 729  7.48%  R88 005  R60 580  3.17
         proach to investing.      30 (R)    9.76%  R16 322  R5 148  8.31%  R159 740  R86 685  4.45
          FUND FOCUS                HISTORICAL DISTRIBUTIONS Actual payout (cents/unit) & 12-mnth historic yields
         The Marriott Income Fund has as its pri-  Period Ending End Price  Jan  Feb  Mar  Apr  May  Jun  Jul  Aug  Sep  Oct  Nov  Dec 12-mn
                                                                                      th
         mary objective to maximise income yield                                     DY%
         as well as achieve capital stability. To  31 Dec 24 (R)  113.05  0.81  0.78  0.83  0.82  0.85  0.83  0.83  0.83  0.81  0.82  0.82  0.80  8.69
         achieve this objective, the securities nor-  31 Dec 23 (R)  111.83  0.68  0.63  0.71  0.70  0.74  0.77  0.80  0.82  0.82  0.83  0.84  0.82  8.19
         mally to be included in the portfolio will  31 Dec 22 (R)  110.79  0.52  0.48  0.55  0.54  0.57  0.59  0.63  0.65  0.64  0.67  0.67  0.71  6.52
                                                                  0.48
                                                               0.46
                                           112.08
                                                                     0.50
                                                            0.47
                                                         0.46
                                                      0.48
                                               0.45
                                                   0.41
                                                                                  0.53
                                                                                     5.07
                                   31 Dec 21 (R)
                                                                         0.47
                                                                            0.49
                                                                               0.50
         consist of fixed income securities, high  31 Dec 20 (R)  113.19  0.70  0.65  0.68  0.61  0.55  0.50  0.49  0.46  0.42  0.43  0.42  0.44  5.62
         yielding securities, non-equity securities
         and liquid assets. Nothing precludes the                   Risk / Return Profile
         Manager from retaining cash in the port-                  25
         folio or placing cash on deposits. Call
         rates provide the fund with a benchmark.
         Although the mandate does not prescribe
         it, the portfolio is managed in conformity            3yr Compound  return(%)  12
         with prudential investment guidelines.
          DETAILS as at 31 December 2024
          All fees and charges include Vat                         0 0      10      20
                                                                        Volatility p.a.
         Formation date:  15 Oct 1993
         Min lump sum:        R500  PORTFOLIO ALLOCATION
         Minimum monthly:     R300                     December 2024    June 2024
         Top-up investment:   R300  Sector            Value (Rmil)  % of Fund  Value (Rmil)  % of Fund  Difference
         No of holdings:        58  Floating Corporate Debt  236  44.70%  202  40.70%  4.00%
         No of unitholders:    814  Preference Shares       4   0.70%     4   0.70%  0.00%
                                   Cash and Short Term Deposits  26  4.90%  79  15.90%  -11.00%
         Original price:       100  Medium Term Fixed Deposits  18  3.40%  18  3.70%  -0.30%
         Broker p.a. com (R):  0.58%  RSA Government Bonds and Bills  245  46.20%  194  39.00%  7.30%
         Annual fee (R):      0.69%  TOTAL                529  100.00%   497  100.00%  6.44%
         TER (R) 12/24:       0.72%  TOP HOLDINGS BY VALUE
         TER Perf% (R):       0.00%                   December 2024   June 2024
         Fund value:       R528.96m  Short Name/     Units  Value  %of  Units  Value  %of
                                   JSE Code  Sector Name  (000’s) (R ‘000)  Fund  (000’s)  (R ‘000)  Fund  Difference
         Risk rating:   Low - Medium
                                   R2030   SA Bnds  110 192  105 935 19.68%  110 192  105 404  21.19%  0
         PlexCrowns:               R213    SA Bnds   40 135  37 013  6.88%  60 232  52 403  10.54%  -20 097
         Income declaration:  Monthly  RN2030  SA Bnds  28 750  28 536  5.30%  14 000  13 737  2.76%  14 750
                                   R2032   SA Bnds   28 630  27 378  5.09%
                                   NDBB02  SA Bnds   12 000  11 968  2.22%  12 000  11 995  2.41%  0
                                   I2029   SA Bnds   8 114  10 868  2.02%  8 114  10 411  2.10%  0
                                   BPPF51  SA Bnds   10 000  10 020  1.86%
                                   TFS179  SA Bnds   9 000  9 025  1.68%  9 000  8 991  1.81%  0
                                   OML18   SA Bnds   9 000  9 024  1.68%  9 000  8 999  1.81%  0
                                   SSA10   SA Bnds   9 000  9 001  1.67%  9 000  9 000  1.81%  0
                                   TOTAL                 258 766 48.08%  237 978  47.86%
                                            Price History       Relative Strength to SA Bond Index - TRI
                                      114.0                     1.5
                                                                1.3
                                      112.5
                                                                1.1
                                      111.0
                                                                0.9
                                     109.5
                                                                0.7
                                     108.0
                                        15 | 16 | 17 | 18 | 19 | 20 | 21 | 22 | 23 | 24  0.5
                                                                   J  F  M  A  M  J  J  A
         Profile’s Unit Trusts & Collective Investments — DOMESTIC                   277