
Page 277 - Profiles's Unit Trusts & Collective Investments - September 2024
P. 277
Marriott International Growth Feeder Fund
Marriott International Growth Feeder Fund
Marriott International Growth Feeder Fund
Sector: Global—Multi Asset—Flexible
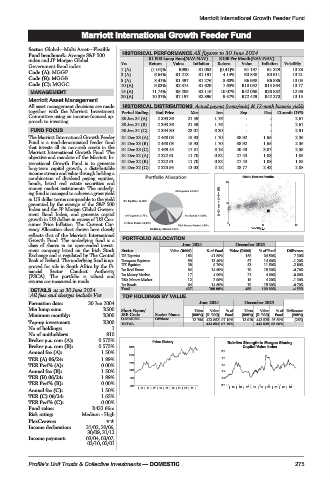
Fund benchmark: Average S&P 500 HISTORICAL PERFORMANCE All figures to 30 June 2024
index and JP Morgan Global R1 000 Lump Sum(NAV-NAV) R100 Per Month(NAV-NAV)
Government Bond index Yrs Return Value Inflation Return Value Inflation Volatility
Code (A): MGGF 1 (A) (1.04)% R990 R1 052 (0.41)% R1 197 R1 229 13.28
Code (B): MGGB 3 (A) 6.64% R1 213 R1 191 4.14% R3 840 R3 911 13.21
13.05
5 (A)
R6 886
R1 276
5.60%
R6 938
8.41%
R1 497
Code (C): MGGC 10 (A) 9.03% R2 374 R1 629 7.65% R18 052 R15 564 13.77
MANAGEMENT 15 (A) 11.74% R5 285 R2 116 10.07% R42 060 R26 882 12.96
20 (A) 10.37% R7 197 R2 896 9.57% R72 429 R42 270 13.15
Marriott Asset Management
All asset management decisions are made HISTORICAL DISTRIBUTIONS Actual payout (cents/unit) & 12-mnth historic yields
together with the Marriott Investment Period Ending End Price Mar Jun Sep Dec 12-mnth DY%
Committee using an income-focused ap- 30 Jun 24 (A) 2 393.36 21.59 1.76 - - 2.67
proach to investing.
30 Jun 24 (B) 2 393.36 21.59 1.76 - - 2.67
FUND FOCUS 30 Jun 24 (C) 2 394.80 23.07 3.20 - - 2.91
The Marriott International Growth Feeder 31 Dec 23 (A) 2 468.03 15.93 1.70 38.92 1.65 2.36
Fund is a rand-denominated feeder fund 31 Dec 23 (B) 2 468.03 15.93 1.70 38.92 1.65 2.36
that invests all its non-cash assets in the 31 Dec 23 (C) 2 469.45 17.31 3.18 40.40 3.07 2.59
Marriott International Growth Fund. The 31 Dec 22 (A) 2 222.61 11.70 0.82 27.43 1.08 1.85
objective and mandate of the Marriott In-
ternational Growth Fund is to generate 31 Dec 22 (B) 2 222.61 11.70 0.82 27.43 1.08 1.85
long-term capital growth, a distributable 31 Dec 22 (C) 2 223.95 13.03 2.12 28.77 2.42 2.08
income stream and value through holding a
combination of dividend paying equities, Risk / Return Profile
bonds, listed real estate securities and 20
money market instruments. The underly-
ing fund is managed to achieve a gross yield
in US dollar terms comparable to the yield 3yr Compound return(%)
generated by the average of the S&P 500 10
Index and the JP Morgan Global Govern-
ment Bond Index, and generate capital
growth in US dollars in excess of US Con-
sumer Price Inflation. The Current Cur- 0 0 11 22
rency Allocation chart shown here closely Volatility p.a.
reflects that of the Marriott International
Growth Fund. The underlying fund is a PORTFOLIO ALLOCATION
classof sharesinanopen-ended invest- June 2024 December 2023
ment company listed on the Irish Stock Sector Value (R000) % of Fund Value (R000) % of Fund Difference
Exchange and is regulated by The Central US Equities 183 41.80% 158 34.50% 7.30%
Bank of Ireland. The underlying fund is ap- European Equities 59 13.40% 67 14.60% -1.20%
proved for sale in South Africa by the Fi- UK Equities 38 8.70% 53 11.50% -2.80%
nancial Sector Conduct Authority Int Real Estate 64 14.60% 70 15.30% -0.70%
(FSCA). The portfolio is valued and Int Money Market 17 4.00% 21 4.60% -0.60%
returns are measured in rands. RSA Money Market 12 2.90% 19 4.20% -1.30%
Int Bonds 64 14.60% 70 15.30% -0.70%
DETAILS as at 30 June 2024 Total 437 100.00% 458 100.00% -4.59%
All fees and charges include Vat TOP HOLDINGS BY VALUE
Formation date: 30 Jun 2004 June 2024 December 2023
Min lump sum: R500 Short Name/ Units Value %of Units Value %of Difference
Minimum monthly: R300 JSE Code Sector Name (000’s) (R ‘000) Fund (000’s) (R ‘000) Fund (000’s)
Top-up investment: R300 O-MARINC Offshore 12 756 423 852 97.10% 13 019 443 525 95.89% (263)
No of holdings: 1 TOTAL 423 852 97.10% 443 525 95.89%
No of unitholders: 810
Broker p.a. com (A): 0.575%
Price History Relative Strength to Morgan Stanley
Broker p.a. com (B): 0.575% 2570 Capital Value index
Annual fee (A): 1.50% 2.0
2174
TER (A) 06/24: 1.89% 1.7
TER Perf% (A): 0.00% 1778 1.5
Annual fee (B): 1.50% 1382 1.2
TER (B) 06/24: 1.89% 986 1.0
TER Perf% (B): 0.00%
590 |15|16 |17|18 |19|20 |21|22 |23| 0.7 |15| 16 |17| 18 |19 | 20 |21 | 22 | 23|
Annual fee (C): 1.50%
TER (C) 06/24: 1.65%
TER Perf% (C): 0.00%
Fund value: R433.66m
Risk rating: Medium - High
PlexCrowns:
Income declaration: 31/03, 30/06,
30/09, 31/12
Income payment: 03/04, 03/07,
03/10, 03/01
Profile’s Unit Trusts & Collective Investments — DOMESTIC 275