
Page 281 - Profiles's Unit Trusts & Collective Investments - September 2024
P. 281
Marriott Property Income Fund
Marriott Property Income Fund
Marriott Property Income Fund
Sector: South African—Real Estate—
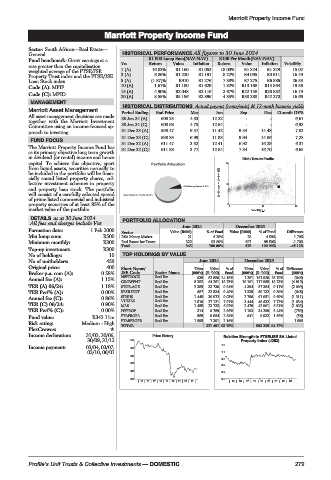
General HISTORICAL PERFORMANCE All figures to 30 June 2024
Fund benchmark: Grow earnings at a R1 000 Lump Sum(NAV-NAV) R100 Per Month(NAV-NAV)
rate greater than the capitalisation Yrs Return Value Inflation Return Value Inflation Volatility
weighted average of the FTSE/JSE 1 (A) 16.02% R1 160 R1 052 18.00% R1 324 R1 229 15.02
Property Trust index and the FTSE/JSE 3 (A) 6.86% R1 220 R1 191 8.22% R4 095 R3 911 16.49
Loan Stock index 5 (A) (1.87)% R910 R1 276 7.38% R7 275 R6 886 26.53
Code (A): MPIF 10 (A) 1.67% R1 180 R1 629 1.82% R13 168 R15 564 19.56
15 (A) 4.90% R2 048 R2 116 2.67% R22 158 R26 882 16.79
Code (C): MPID
20 (A) 8.55% R5 156 R2 896 4.35% R38 288 R42 270 16.66
MANAGEMENT
HISTORICAL DISTRIBUTIONS Actual payout (cents/unit) & 12-mnth historic yields
Marriott Asset Management Period Ending End Price Mar Jun Sep Dec 12-mnth DY%
All asset management decisions are made 30 Jun 24 (A) 608.25 4.33 12.22 - - 6.67
together with the Marriott Investment
Committee using an income-focused ap- 30 Jun 24 (C) 608.68 4.75 12.64 - - 6.93
proach to investing. 31 Dec 23 (A) 598.47 6.57 11.42 9.54 14.48 7.02
31 Dec 23 (C) 598.85 6.99 11.83 9.94 14.86 7.28
FUND FOCUS
31 Dec 22 (A) 611.47 3.32 12.41 6.92 16.29 6.37
The Marriott Property Income Fund has 31 Dec 22 (C) 611.88 3.77 12.84 7.34 16.70 6.65
as its primary objective long term growth
in dividend (or rental) income and hence Risk / Return Profile
capital. To achieve this objective, apart 20
from liquid assets, securities normally to
be included in the portfolio will be finan-
cially sound listed property shares, col-
lective investment schemes in property 3yr Compound return(%) 10
and property loan stock. The portfolio
will consist of a carefully selected spread
of prime listed commercial and industrial
property securities of at least 85% of the 0 0 11 22
market value of the portfolio. Volatility p.a.
DETAILS as at 30 June 2024 PORTFOLIO ALLOCATION
All fees and charges include Vat
June 2024 December 2023
Formation date: 1 Feb 2000 Sector Value (R000) % of Fund Value (R000) % of Fund Difference
Min lump sum: R500 RSA Money Market 21 6.20% 28 4.50% 1.70%
Minimum monthly: R300 Real Estate Inv Trusts 322 93.80% 597 95.50% -1.70%
Top-up investment: R300 Total 343 100.00% 625 100.00% -45.12%
No of holdings: 10 TOP HOLDINGS BY VALUE
No of unitholders: 459 June 2024 December 2023
Original price: 400 Short Name/ Units Value %of Units Value %of Difference
Broker p.a. com (A): 0.58% JSE Code Sector Name (000’s) (R ‘000) Fund (000’s) (R ‘000) Fund (000’s)
(646)
635
1 281 161 920 25.70%
Annual fee (A): 1.15% NEPIROCK Real Est 5 282 82 886 24.18% 10 101 117 985 18.73% (4 819)
GROWPNT
Real Est
64 281 18.75%
TER (A) 06/24: 1.18% STOR-AGE Real Est 2 385 33 730 9.84% 4 394 57 384 9.11% (2 009)
TER Perf% (A): 0.00% RESILIENT Real Est 687 32 534 9.49% 1 335 59 132 9.39% (648)
Annual fee (C): 0.86% SIRIUS Real Est 1 445 30 972 9.03% 2 756 61 051 9.69% (1 311)
7.72%
(1 634)
1 810
Real Est
48 632
VUKILE
7.91%
3 444
27 121
TER (C) 06/24: 0.90% MAS Real Est 1 455 23 733 6.92% 2 478 42 901 6.81% (1 023)
TER Perf% (C): 0.00% HYPROP Real Est 314 9 789 2.86% 1 103 34 299 5.44% (789)
Fund value: R343.11m FTAPROPA Real Est 585 9 054 2.64% 641 9 932 1.58% (56)
FTABPROPB Real Est 1 895 7 391 2.16% 1 895
Risk rating: Medium - High TOTAL 321 491 93.78% 593 235 94.17%
PlexCrowns:
Income declaration: 31/03, 30/06, Price History Relative Strength to FTSE/JSE SA Listed
30/09, 31/12 1140 Property Index (J253)
Income payment: 03/04, 03/07, 990 1.2
03/10, 06/01 1.1
840
0.9
690
0.8
540 0.6
390 0.5
|15|16 |17|18 |19|20 |21|22 |23| |15| 16 |17| 18 |19 | 20 |21 | 22 | 23|
Profile’s Unit Trusts & Collective Investments — DOMESTIC 279