
Page 285 - Profiles's Unit Trusts & Collective Investments - September 2024
P. 285
Mazi Asset Management Prime Equity Fund
Mazi Asset Management Prime Equity Fund
Mazi Asset Management Prime Equity Fund
Sector: South African—Equity—General
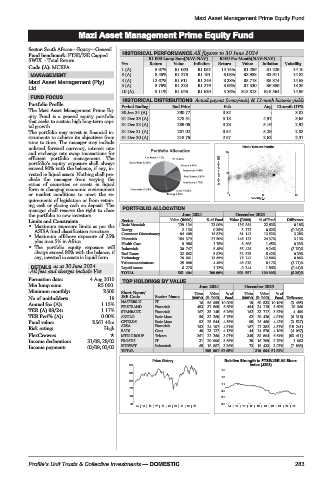
Fund benchmark: FTSE/JSE Capped HISTORICAL PERFORMANCE All figures to 30 June 2024
SWIX - Total Return R1 000 Lump Sum(NAV-NAV) R100 Per Month(NAV-NAV)
Code (A): MCEFA Yrs Return Value Inflation Return Value Inflation Volatility
1 (A) 5.97% R1 060 R1 052 14.15% R1 296 R1 229 14.10
MANAGEMENT 3 (A) 8.46% R1 276 R1 191 6.08% R3 958 R3 911 14.82
Mazi Asset Management (Pty) 4 (A) 12.67% R1 611 R1 249 8.38% R5 718 R5 374 14.68
Ltd. 5 (A) 5.76% R1 323 R1 276 8.66% R7 530 R6 886 18.36
10 (A) 5.11% R1 646 R1 629 5.26% R15 813 R15 564 14.96
FUND FOCUS
HISTORICAL DISTRIBUTIONS Actual payout (cents/unit) & 12-mnth historic yields
Portfolio Profile Period Ending End Price Feb Aug 12-mnth DY%
The Mazi Asset Management Prime Eq- 30 Jun 24 (A) 290.77 3.82 - 3.02
uity Fund is a general equity portfolio
that seeks to sustain high long-term capi- 31 Dec 23 (A) 278.51 5.18 4.97 3.65
tal growth. 31 Dec 22 (A) 289.06 3.28 5.16 2.92
The portfolio may invest in financial in- 31 Dec 21 (A) 287.02 0.54 5.29 2.03
struments to achieve its objectives from 31 Dec 20 (A) 218.76 2.57 2.62 2.37
time to time. The manager may include
unlisted forward currency, interest rate Risk / Return Profile
and exchange rate swap transactions for 20
efficient portfolio management. The
portfolio’s equity exposure shall always
exceed 80% with the balance, if any, in- 3yr Compound return(%)
vested in liquid assets. Nothing shall pre- 10
clude the manager from varying the
ratios of securities or assets in liquid
form in changing economic environment
or market conditions to meet the re- 0 0 11 22
quirements of legislation or from retain- Volatility p.a.
ing cash or placing cash on deposit. The
manager shall reserve the right to close PORTFOLIO ALLOCATION
the portfolio to new investors. June 2024 December 2023
Limits and Constraints Sector Value (R000) % of Fund Value (R000) % of Fund Difference
• Maximum exposure limits as per the Basic Materials 129 134 23.00% 136 854 22.83% 0.18%
ASISA fund classification structure. Energy 2 136 0.38% 3 722 0.62% (0.24)%
• Maximum offshore exposure of 25% Consumer Discretionary 94 408 16.82% 81 142 13.53% 3.28%
plus max 5% in Africa. Financials 154 379 27.50% 146 122 24.37% 3.13%
9 986
8 696
0.33%
• The portfolio equity exposure will Health Care 30 747 1.78% 55 426 1.45% (3.76)%
Industrials
9.24%
5.48%
always exceed 80% with the balance, if Real Estate 32 662 5.82% 32 525 5.42% 0.39%
any, invested in assets in liquid form. Technology 76 661 13.66% 76 742 12.80% 0.86%
Telecommunications 25 008 4.45% 48 978 8.17% (3.71)%
DETAILS as at 30 June 2024 Liquid Assets 6 276 1.12% 9 344 1.56% (0.44)%
All fees and charges include Vat TOTAL 561 404 100.00% 599 557 100.00% (6.36)%
Formation date: 4 Aug 2010 TOP HOLDINGS BY VALUE
Min lump sum: R5 000 June 2024 December 2023
Minimum monthly: R500 Short Name/ Units Value %of Units Value %of
No of unitholders: 18 JSE Code Sector Name (000’s) (R ‘000) Fund (000’s) (R ‘000) Fund Difference
Annual fee (A): 1.15% NASPERS-N IT 16 56 655 10.09% 19 60 533 10.10% (3 485)
FIRSTRAND Financials 493 37 508 6.68% 464 34 115 5.69% 29 369
TER (A) 03/24: 1.17% STANBANK Financials 167 35 148 6.26% 162 33 717 5.62% 4 490
TER Perf% (A): 0.00% ANGLO Basic Mats 56 32 269 5.75% 62 29 420 4.91% (6 316)
Fund value: R561.40m GFIELDS Basic Mats 92 25 544 4.55% 95 26 480 4.42% (3 527)
ABSA Financials 152 24 197 4.31% 167 27 382 4.57% (15 241)
Risk rating: High
BATS Cons 40 23 127 4.12% 44 24 570 4.10% (4 097)
PlexCrowns: MTN GROUP Telcom 261 22 260 3.97% 345 39 804 6.64% (83 411)
Income declaration: 31/08, 28/02 PROSUS IT 31 20 006 3.56% 29 16 209 2.70% 1 903
Income payment: 03/09, 03/03 BIDVEST Industrials 65 18 887 3.36% 73 18 433 3.07% (7 803)
TOTAL 295 601 52.65% 310 664 51.82%
Price History Relative Strength to FTSE/JSE All Share
310 index (J203)
1.5
266
1.3
222
1.1
178
0.9
134 0.7
90 0.5
14 | 15 | 16 | 17 | 18 | 19 | 20 | 21 | 22 | 23 14 | 15 | 16 | 17 | 18 | 19 | 20 | 21 | 22 | 23
Profile’s Unit Trusts & Collective Investments — DOMESTIC 283