
Page 282 - Profiles's Unit Trusts & Collective Investments - September 2024
P. 282
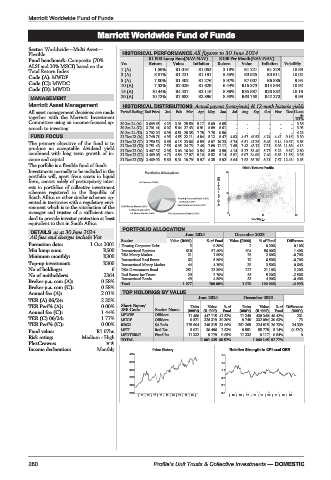
Marriott Worldwide Fund of Funds

                            Marriott Worldwide Fund of Funds
         Marriott Worldwide Fund of Funds
         Sector: Worldwide—Multi Asset—
         Flexible                   HISTORICAL PERFORMANCE All figures to 30 June 2024
         Fund benchmark: Composite (70%    R1 000 Lump Sum(NAV-NAV)  R100 Per Month(NAV-NAV)
         ALSI and 30% MSCI) based on the  Yrs  Return  Value  Inflation  Return  Value  Inflation  Volatility
         Total Return Index        1 (A)     1.59%  R1 016  R1 052  3.18%  R1 221  R1 229  10.99
         Code (A): MWDF            3 (A)     6.87%  R1 221  R1 191  5.55%  R3 925  R3 911  10.02
                                   5 (A)     7.00%  R1 402  R1 276  5.97%  R7 007  R6 886  9.94
         Code (C): MWDC
                                   10 (A)    7.33%  R2 029  R1 629  6.44%  R16 873  R15 564  10.92
         Code (D): MWDD
                                   15 (A)   10.44%  R4 437  R2 116  8.36%  R35 987  R26 882  10.16
          MANAGEMENT               20 (A)   10.73%  R7 683  R2 896  8.58%  R63 750  R42 270  9.99
         Marriott Asset Management  HISTORICAL DISTRIBUTIONS Actual payout (cents/unit) & 12-mnth historic yields
         All asset management decisions are made  Period Ending End Price  Jan  Feb  Mar  Apr  May  Jun  Jul  Aug  Sep  Oct  Nov  Dec 12-mn
         together with the Marriott Investment                                        th
         Committee using an income-focused ap-  30 Jun 24 (A)  3 699.65  4.23  3.91 25.59  5.17  5.09  6.85  -  -  -  -  -  -  DY%
                                                                                     3.36
         proach to investing.      30 Jun 24 (C)  3 701.41  6.07  5.64 27.43  6.91  6.89  8.61  -  -  -  -  -  -  3.93
                                   30 Jun 24 (D)  3 702.29  6.98  6.51 28.35  7.78  7.78  9.50  -  -  -  -  -  -  4.22
          FUND FOCUS               31 Dec 23 (A) 3 748.71  4.95  4.55 22.11  4.84  5.12  8.47  4.93  4.67 45.53  4.74  4.47  9.16  3.30
         The primary objective of the fund is to  31 Dec 23 (C) 3 750.52  6.68  6.15 23.86  6.59  6.97 10.23  6.74  6.51 47.26  6.45  6.14 10.97  3.85
         produce an acceptable dividend yield  31 Dec 23 (D) 3 751.42  7.55  6.95 24.73  7.46  7.89 11.11  7.65  7.42 48.12  7.31  6.98 11.88  4.13
         combined with long term growth of in-  31 Dec 22 (A) 3 467.37  2.96  3.00 16.34  3.54  3.85  3.59  4.14  5.27 33.40  5.77  5.22  9.87  2.80
                                   31 Dec 22 (C) 3 469.08
                                               4.72
                                                               5.14
                                                                                     3.36
                                                                            7.40
                                                                  5.81
                                                            5.52
                                                                               6.85 11.58
                                                         5.16
                                                                     6.97 34.99
                                                   4.54 17.97
         come and capital.         31 Dec 22 (D) 3 469.92  5.60  5.31 18.79  5.97  6.35  5.92  6.64  7.82 35.79  8.21  7.67 12.43  3.65
         The porfolio is a flexible fund of funds.
         Investments normally to be included in the              20   Risk / Return Profile
         portfolio will, apart from assets in liquid
         form, consist solely of participatory inter-
         ests in portfolios of collective investment
         schemes registered in the Republic of                 3yr Compound return(%)  10
         South Africa or other similar schemes op-
         erated in territories with a regulatory envi-
         ronment which is to the satisfaction of the
         manager and trustee of a sufficient stan-               0
                                                                           11
         dard to provide investor protection at least             0     Volatility p.a.  22
         equivalent to that in South Africa.
                                    PORTFOLIO ALLOCATION
          DETAILS as at 30 June 2024
          All fees and charges include Vat            June 2024     December 2023
                                   Sector        Value (R000)  % of Fund  Value (R000)  % of Fund  Difference
         Formation date:  1 Oct 2001  Floating Corporate Debt  3  0.30%  2  0.20%   0.10%
         Min lump sum:        R500  International Equities  618  57.40%  604  56.00%  1.40%
         Minimum monthly:     R300  RSA Money Market  21     1.90%     28   2.60%   -0.70%
         Top-up investment:   R300  InternationalRealEstate  62  5.80%  70  6.50%   -0.70%
                                                      44
                                                                       38
                                                             4.10%
                                                                            3.50%
                                                                                    0.60%
                                   International Money Market
         No of holdings:         6  RSA Government Bond  251  23.30%  227   21.10%  2.20%
         No of unitholders:   2364  Real Estate Inv Trusts  29  2.70%  56   5.20%   -2.50%
                                   International Bonds  49   4.50%     53   4.90%   -0.40%
         Broker p.a. com (A):  0.58%  Total          1 077  100.00%   1 078  100.00%  -0.09%
         Broker p.a. com (C):  0.58%
         Annual fee (A):      2.01%  TOP HOLDINGS BY VALUE
         TER (A) 06/24:       2.35%                      June 2024    December 2023
         TER Perf% (A):       0.00%  Short Name/       Units  Value  %of  Units  Value  %of Difference
         Annual fee (C):      1.44%  JSE Code  Sector Name  (000’s)  (R ‘000)  Fund  (000’s)  (R ‘000)  Fund  (000’s)
                                                      11 480
                                                           447 115 41.52%
                                                                          438 340 40.42%
                                   MFWEF
                                             Offshore
                                                                     11 249
                                                                                     231
         TER (C) 06/24:       1.77%  MIIGF   Offshore  9 821  326 319 30.30%  9 748  332 094 30.63%  73
         TER Perf% (C):       0.00%  R2032   SA Bnds  275 604  248 315 23.06%  251 265  224 815 20.73%  24 339
         Fund value:        R1.07bn  MPIF    Real Est  5 021  30 496  2.83%  9 551  55 778  5.14%  (4 530)
                                   MEDTERMI  Fixed Int  11 332  9 179  0.85%  11 332  9 117  0.84%  0
         Risk rating:   Medium - High  TOTAL              1 061 425 98.57%  1 060 145 97.77%
         PlexCrowns:
         Income declaration:  Monthly       Price History         Relative Strength to CPI excl OER
                                      4000
                                                                1.5
                                      3600                      1.3
                                      3200                      1.1
                                      2800                      0.9
                                      2400                      0.7
                                      2000                      0.5  |15|16 |17 | 18 |19|20 |21 | 22 |23|
                                        |15|16 |17|18 |19|20 |21|22 |23|
         280                                Profile’s Unit Trusts & Collective Investments — DOMESTIC