
Page 280 - Profiles's Unit Trusts & Collective Investments - September 2024
P. 280
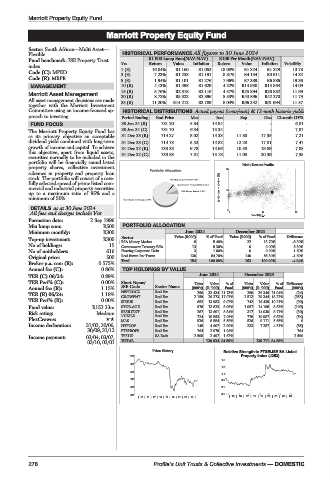
Marriott Property Equity Fund

                               Marriott Property Equity Fund
         Marriott Property Equity Fund
         Sector: South African—Multi Asset—
         Flexible                   HISTORICAL PERFORMANCE All figures to 30 June 2024
         Fund benchmark: JSE Property Trust  R1 000 Lump Sum(NAV-NAV)  R100 Per Month(NAV-NAV)
         index                     Yrs     Return  Value  Inflation  Return  Value  Inflation  Volatility
         Code (C): MPED            1 (R)    16.04%  R1 160  R1 052  18.08%  R1 324  R1 229  13.78
         Code (R): MRPR            3 (R)     7.23%  R1 233  R1 191  8.81%  R4 134  R3 911  14.32
                                   5 (R)     1.94%  R1 101  R1 276  7.96%  R7 389  R6 886  19.36
          MANAGEMENT               10 (R)    4.13%  R1 498  R1 629  4.22%  R14 950  R15 564  14.09
                                   15 (R)    5.76%  R2 318  R2 116  4.57%  R25 894  R26 882  11.99
         Marriott Asset Management  20 (R)   8.72%  R5 322  R2 896  5.53%  R43 896  R42 270  11.79
         All asset management decisions are made  25 (R)  11.20%  R14 212  R3 789  8.04%  R96 342  R61 994  11.57
         together with the Marriott Investment
         Committee using an income-focused ap-  HISTORICAL DISTRIBUTIONS Actual payout (cents/unit) & 12-mnth historic yields
         proach to investing.      Period Ending  End Price  Mar  Jun  Sep  Dec  12-mnth DY%
          FUND FOCUS               30 Jun 24 (R)  731.20  5.84  14.84  -     -       6.81
         The Marriott Property Equity Fund has  30 Jun 24 (C)  731.70  6.34  15.34  -  -  7.07
         as its primary objective an acceptable  31 Dec 23 (R)  714.27  8.02  14.33  11.80  17.35  7.21
         dividend yield combined with long-term  31 Dec 23 (C)  714.73  8.52  14.82  12.28  17.81  7.47
         growth of income and capital. To achieve  31 Dec 22 (R)  733.33  6.78  14.66  10.58  19.89  7.08
         this objective, apart from liquid assets,  31 Dec 22 (C)  733.83  7.31  15.18  11.08  20.39  7.35
         securities normally to be included in the
         portfolio will be financially sound listed                   Risk / Return Profile
         property shares, collective investment                  20
         schemes in property and property loan
         stock. The portfolio will consist of a care-
         fully selected spread of prime listed com-
         mercial and industrial property securities            3yr Compound return(%)  10
         up to a maximum ratio of 85% and a
         minimum of 50%.
          DETAILS as at 30 June 2024                             0
          All fees and charges include Vat                        0        11       22
                                                                        Volatility p.a.
         Formation date:  2 Sep 1996
         Min lump sum:        R500  PORTFOLIO ALLOCATION
         Minimum monthly:     R300                   June 2024      December 2023
                                   Sector         Value (R000)  % of Fund  Value (R000)  % of Fund  Difference
         Top-up investment:   R300
         No of holdings:        15  RSA Money Market   13 8  5.40%     22 0  13.70%  -8.30%
                                   Government Treasury Bills
                                                                            0.00%
                                                                                    8.30%
                                                             8.30%
         No of unitholders:    616  Floating Corporate Debt  3  1.60%   0   0.00%   1.60%
         Original price:       500  Real Estate Inv Trusts  130  84.70%  140  86.30%  -1.60%
                                   Total               154  100.00%   162  100.00%  -4.94%
         Broker p.a. com (R):  0.575%
         Annual fee (C):      0.86%  TOP HOLDINGS BY VALUE
         TER (C) 06/24:       0.89%                      June 2024    December 2023
         TER Perf% (C):       0.00%  Short Name/        Units  Value  %of  Units  Value  %of Difference
         Annual fee (R):      1.15%  JSE Code  Sector Name  (000’s) (R ‘000)  Fund  (000’s) (R ‘000)  Fund  (000’s)
                                   NEPIROCK  Real Est    256  33 434 21.73%  280  35 346 21.94%  (24)
         TER (R) 06/24:       1.18%  GROWPNT  Real Est  2 159  26 273 17.07%  2 512  29 344 18.22%  (353)
         TER Perf% (R):       0.00%  SIRIUS  Real Est    652  13 983  9.07%  742  16 439 10.21%  (90)
         Fund value:       R153.33m  STOR-AGE  Real Est  978  13 823  8.98%  1 087  14 198  8.82%  (109)
         Risk rating:       Medium  RESILIENT  Real Est  287  13 601  8.84%  317  14 030  8.71%  (30)
                                   VUKILE    Real Est    724  10 853  7.05%  778  10 987  6.82%  (54)
         PlexCrowns:               MAS       Real Est    526  8 584  5.58%  526  9 111  5.66%  0
         Income declaration:  31/03, 30/06,  HYPROP  Real Est  148  4 607  2.99%  233  7 257  4.51%  (85)
                          30/09, 31/12  FTBPROPB  Real Est  764  2 979  1.94%        764
         Income payment:  03/04, 03/07,  TFS179  SA Bnds  2 500  2 497  1.62%       2 500
                          03/10, 03/01  TOTAL              130 634 84.89%  136 711 84.88%
                                            Price History       Relative Strength to FTSE/JSE SA Listed
                                      1100                           Property Index (J253)
                                                                1.5
                                      980
                                                                1.3
                                      860
                                                                1.1
                                      740
                                                                0.9
                                      620                       0.7
                                      500                       0.5  |15| 16 |17| 18 |19 | 20 |21 | 22 | 23|
                                        |15|16 |17|18 |19|20 |21|22 |23|
         278                                Profile’s Unit Trusts & Collective Investments — DOMESTIC