
Page 278 - Profiles's Unit Trusts & Collective Investments - September 2024
P. 278
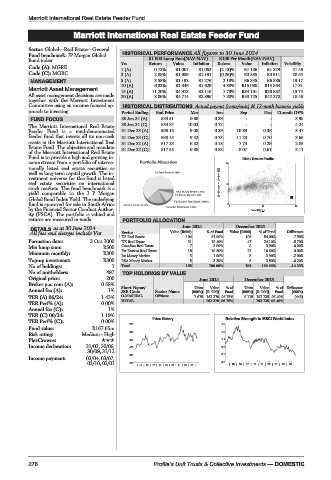
Marriott International Real Estate Feeder Fund

                      Marriott International Real Estate Feeder Fund
         Marriott International Real Estate Feeder Fund
         Sector: Global—Real Estate—General
         Fund benchmark: JP Morgan Global  HISTORICAL PERFORMANCE All figures to 30 June 2024
         Bond index                        R1 000 Lump Sum(NAV-NAV)  R100 Per Month(NAV-NAV)
         Code (A): MGRE            Yrs     Return  Value  Inflation  Return  Value  Inflation  Volatility
         Code (C): MGRC            1 (A)     0.72%  R1 007  R1 052  (2.13)%  R1 186  R1 229  21.46
                                   3 (A)     2.88%  R1 089  R1 191  (0.26)%  R3 585  R3 911  20.55
          MANAGEMENT               5 (A)     3.58%  R1 192  R1 276  2.18%  R6 345  R6 886  19.17
                                   10 (A)    6.32%  R1 846  R1 629  4.38%  R15 080  R15 564  17.31
         Marriott Asset Management  15 (A)  11.20%  R4 913  R2 116  7.79%  R34 191  R26 882  15.72
         All asset management decisions are made  20 (A)  8.06%  R4 714  R2 896  7.20%  R53 725  R42 270  18.46
         together with the Marriott Investment
         Committee using an income-focused ap-  HISTORICAL DISTRIBUTIONS Actual payout (cents/unit) & 12-mnth historic yields
         proach to investing.      Period Ending  End Price  Mar  Jun  Sep  Dec  12-mnth DY%
          FUND FOCUS               30 Jun 24 (A)  534.51  9.68  0.39  -      -       3.99
         The Marriott International Real Estate  30 Jun 24 (C)  534.84  10.03  0.72  -  -  4.24
         Feeder Fund is a rand-denominated  31 Dec 23 (A)  598.13  9.08  0.39  10.89  0.38  3.47
         feeder fund that invests all its non-cash  31 Dec 23 (C)  598.45  9.42  0.73  11.23  0.70  3.69
         assets in the Marriott International Real  31 Dec 22 (A)  517.23  6.52  0.18  7.73  0.29  2.85
         Estate Fund. The objective and mandate  31 Dec 22 (C)  517.55  6.88  0.53  8.07  0.61  3.11
         of the Marriott International Real Estate
         Fund is to provide a high and growing in-                    Risk / Return Profile
         come stream from a portfolio of interna-                20
         tionally listed real estate securities as
         well as long-term capital growth. The in-
         vestment universe for this fund is listed
         real estate securities on international               3yr Compound return(%)  10
         stock markets. The fund benchmark is a
         yield comparable to the J P Morgan
         Global Bond Index Yield. The underlying
         fund is approved for sale in South Africa               0 0       11       22
         by the Financial Sector Conduct Author-                        Volatility p.a.
         ity (FSCA). The portfolio is valued and
         returns are measured in rands.  PORTFOLIO ALLOCATION
                                                     June 2024      December 2023
          DETAILS as at 30 June 2024  Sector
          All fees and charges include Vat       Value (R000)  % of Fund  Value (R000)  % of Fund  Difference
                                   US Real Estate     104    61.90%   106   54.00%  7.90%
         Formation date:  3 Oct 2000  UK Real Estate  31     18.40%    47   24.10%  -5.70%
         Min lump sum:        R500  Canadian Real Estate  7  3.90%      8   3.90%   0.00%
                                                                                    0.00%
         Minimum monthly:     R300  Far Eastern Real Estate  18 3  10.60%  21 8  10.60%  -2.00%
                                                                            3.90%
                                                             1.90%
                                   Int Money Market
         Top-up investment:   R300  RSA Money Market   5     3.30%      6   3.50%   -0.20%
         No of holdings:         1  Total            168    100.00%   196  100.00%  -14.29%
         No of unitholders:    497  TOP HOLDINGS BY VALUE
         Original price:       200                       June 2024    December 2023
         Broker p.a. com (A):  0.58%  Short Name/
                                                                 %of
                                                            Value
                                                        Units
                                                                           Value
                                                                               %of Difference
                                                                      Units
         Annual fee (A):       1%  JSE Code  Sector Name  (000’s) (R ‘000)  Fund  (000’s) (R ‘000)  Fund  (000’s)
         TER (A) 06/24:       1.43%  O-MARREAL  Offshore  7 675 162 270 96.75%  8 118 192 735 96.40%  (443)
         TER Perf% (A):       0.00%  TOTAL                 162 270 96.75%  192 735 96.40%
         Annual fee (C):       1%
         TER (C) 06/24:       1.19%
                                            Price History        Relative Strength to MSCI World index
         TER Perf% (C):       0.00%
                                      700                       1.5
         Fund value:       R167.65m
         Risk rating:   Medium - High  610                      1.3
         PlexCrowns:                  520                       1.1
         Income declaration:  31/03, 30/06,  430                0.9
                          30/09, 31/12
                                      340                       0.7
         Income payment:  03/04, 03/07,
                          03/10, 03/01  250  | 15 | 16 | 17 | 18 | 19 | 20 | 21 | 22 | 23 |  0.5  |15|16 |17 | 18 |19|20 |21 | 22 |23|

         276                                Profile’s Unit Trusts & Collective Investments — DOMESTIC