
Page 273 - Profiles's Unit Trusts & Collective Investments - September 2024
P. 273
Marriott First World Equity Feeder Fund
Marriott First World Equity Feeder Fund
Marriott First World Equity Feeder Fund
Sector: Global—Equity—General
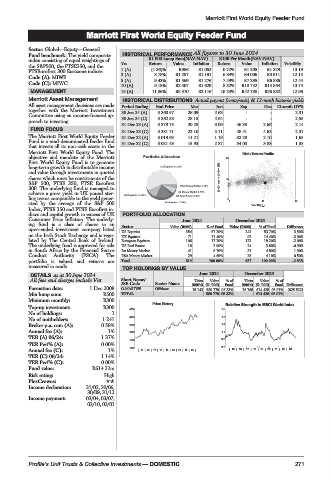
Fund benchmark: The yield composite HISTORICAL PERFORMANCE All figures to 30 June 2024
index consisting of equal weightings of R1 000 Lump Sum(NAV-NAV) R100 Per Month(NAV-NAV)
the S&P500, the FTSE350, and the Yrs Return Value Inflation Return Value Inflation Volatility
FTSEurofirst 300 Eurozone indices. 1 (A) (1.36)% R986 R1 052 0.72% R1 205 R1 229 13.19
Code (A): MIWE 3 (A) 8.78% R1 287 R1 191 6.84% R4 006 R3 911 12.15
5 (A) 9.43% R1 569 R1 276 7.49% R7 295 R6 886 12.44
Code (C): MIWC
10 (A) 9.18% R2 407 R1 629 8.32% R18 752 R15 564 13.74
MANAGEMENT 15 (A) 11.86% R5 370 R2 116 10.24% R42 738 R26 882 12.96
Marriott Asset Management HISTORICAL DISTRIBUTIONS Actual payout (cents/unit) & 12-mnth historic yields
All asset management decisions are made Period Ending End Price Mar Jun Sep Dec 12-mnth DY%
together with the Marriott Investment 30 Jun 24 (A) 3 360.57 26.09 2.63 - - 2.31
Committee using an income-focused ap-
proach to investing. 30 Jun 24 (C) 3 362.58 28.15 4.64 - - 2.55
31 Dec 23 (A) 3 379.75 20.25 3.09 46.38 2.66 2.14
FUND FOCUS 31 Dec 23 (C) 3 381.71 22.10 5.11 48.41 4.62 2.37
The Marriott First World Equity Feeder 31 Dec 22 (A) 3 019.65 14.21 1.19 32.28 2.10 1.65
Fund is a rand-denominated feeder fund 31 Dec 22 (C) 3 021.43 15.93 2.87 34.03 3.88 1.88
that invests all its non-cash assets in the
Marriott First World Equity Fund. The Risk / Return Profile
objective and mandate of the Marriott 20
First World Equity Fund is to generate
long-term growth in distributable income
and value through investments in quoted
shares which must be constituents of the 3yr Compound return(%) 10
S&P 500, FTSE 350, FTSE Eurofirst
300. The underlying fund is managed to
achieve a gross yield in UK pound ster-
ling terms comparable to the yield gener- 0 0 11 22
ated by the average of the S&P 500 Volatility p.a.
Index, FTSE 350 and FTSE Eurofirst in-
dices and capital growth in excess of UK PORTFOLIO ALLOCATION
Consumer Price Inflation. The underly- June 2024 December 2023
ing fund is a class of shares in an Sector Value (R000) % of Fund Value (R000) % of Fund Difference
open-ended investment company listed US Equities 354 57.20% 342 53.70% 3.50%
on the Irish Stock Exchange and is regu- UK Equities 71 11.40% 92 14.40% -3.00%
lated by The Central Bank of Ireland. European Equities 106 17.20% 122 19.20% -2.00%
The underlying fund is approved for sale US Real Estate 18 2.90% 24 3.80% -0.90%
in South Africa by the Financial Sector Int Money Market 41 6.70% 31 4.80% 1.90%
Conduct Authority (FSCA). The RSA Money Market 29 4.60% 26 4.10% 0.50%
portfolio is valued and returns are Total 619 100.00% 637 100.00% -2.83%
measured in rands. TOP HOLDINGS BY VALUE
DETAILS as at 30 June 2024 June 2024 December 2023
All fees and charges include Vat Short Name/ Units Value %of Units Value %of
JSE Code Sector Name (000’s) (R ‘000) Fund (000’s) (R ‘000) Fund Difference
Formation date: 1 Dec 2008 O-MARFWE Offshore 15 143 589 779 95.33% 15 768 614 428 95.91% (625 522)
Min lump sum: R500 TOTAL 589 779 95.33% 614 428 95.91%
Minimum monthly: R300
Top-up investment: R300 Price History Relative Strength to MSCI World index
4000 1.8
No of holdings: 1
No of unitholders: 1 241 3400 1.6
Broker p.a. com (A): 0.58% 2800 1.4
Annual fee (A): 1% 2200 1.1
TER (A) 06/24: 1.37%
1600 0.9
TER Perf% (A): 0.00%
Annual fee (C): 1% 1000 |15|16 |17|18 |19|20 |21|22 |23| 0.7 |15|16 |17 | 18 |19|20 |21 | 22 |23|
TER (C) 06/24: 1.14%
TER Perf% (C): 0.00%
Fund value: R614.32m
Risk rating: High
PlexCrowns:
Income declaration: 31/03, 30/06,
30/09, 31/12
Income payment: 03/04, 03/07,
03/10, 03/01
Profile’s Unit Trusts & Collective Investments — DOMESTIC 271