
Page 270 - Profiles's Unit Trusts & Collective Investments - September 2024
P. 270
Marriott Core Income Fund
Marriott Core Income Fund
Marriott Core Income Fund
Sector: South African—Multi Asset—
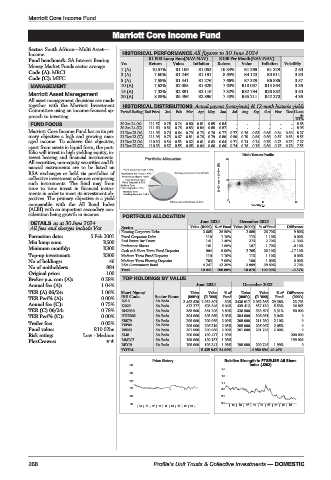
Income HISTORICAL PERFORMANCE All figures to 30 June 2024
Fund benchmark: SA Interest Bearing R1 000 Lump Sum(NAV-NAV) R100 Per Month(NAV-NAV)
Money Market Funds sector average Yrs Return Value Inflation Return Value Inflation Volatility
Code (A): MRCI 1 (A) 10.57% R1 106 R1 052 10.34% R1 269 R1 229 2.50
Code (C): MIFC 3 (A) 7.60% R1 246 R1 191 8.65% R4 123 R3 911 3.30
5 (A) 7.59% R1 441 R1 276 7.66% R7 329 R6 886 3.57
MANAGEMENT 10 (A) 7.63% R2 085 R1 629 7.63% R18 037 R15 564 3.36
15 (A) 7.33% R2 891 R2 116 7.32% R32 794 R26 882 3.50
Marriott Asset Management 20 (A) 8.89% R5 496 R2 896 7.43% R55 211 R42 270 4.36
All asset management decisions are made
together with the Marriott Investment HISTORICAL DISTRIBUTIONS Actual payout (cents/unit) & 12-mnth historic yields
Committee using an income-focused ap- Period Ending End Price Jan Feb Mar Apr May Jun Jul Aug Sep Oct Nov Dec 12-mn
proach to investing. th
DY%
FUND FOCUS 30 Jun 24 (A) 111.57 0.78 0.74 0.80 0.81 0.85 0.84 - - - - - - 8.68
30 Jun 24 (C) 111.60 0.81 0.76 0.83 0.84 0.88 0.87 - - - - - - 8.96
Marriott Core Income Fund has as its pri- 31 Dec 23 (A) 111.95 0.70 0.64 0.79 0.73 0.76 0.77 0.77 0.76 0.83 0.86 0.84 0.80 8.27
mary objective a high and growing man- 31 Dec 23 (C) 111.98 0.73 0.67 0.81 0.76 0.79 0.80 0.80 0.79 0.86 0.88 0.87 0.83 8.55
aged income. To achieve this objective, 31 Dec 22 (A) 110.30 0.54 0.53 0.62 0.61 0.63 0.64 0.71 0.74 0.74 0.78 0.73 0.75 7.27
apart from assets in liquid form, the port- 31 Dec 22 (C) 110.33 0.57 0.55 0.65 0.64 0.66 0.66 0.74 0.76 0.76 0.80 0.76 0.78 7.55
folio will invest in high yielding equity, in-
terest bearing and financial instruments. 20 Risk / Return Profile
All securities, non-equity securities and fi-
nancial instruments are to be listed on
RSA exchanges or held via portfolios of
collective investment schemes comprising 3yr Compound return(%) 10
such instruments. The fund may from
time to time invest in financial instru-
ments in order to meet its investment ob-
jectives. The primary objective is a yield 0
11
comparable with the All Bond Index 0 Volatility p.a. 22
(ALBI) with an important secondary con-
sideration being growth in income. PORTFOLIO ALLOCATION
DETAILS as at 30 June 2024 June 2024 December 2023
All fees and charges include Vat Sector Value (R000) % of Fund Value (R000) % of Fund Difference
Floating Corporate Debt 3 665 36.50% 2 688 26.70% 9.80%
Formation date: 5 Feb 2001 Fixed Corporate Debt 110 1.10% 113 1.10% 0.00%
Min lump sum: R500 Real Estate Inv Trusts 141 1.40% 273 2.70% -1.30%
Minimum monthly: R300 Preference Shares 161 1.60% 167 1.70% -0.10%
Cash and Short Term Fixed Deposits 904 9.00% 2 705 26.10% -17.10%
Top-up investment: R300 Medium Term Fixed Deposits 110 1.10% 113 1.10% 0.00%
No of holdings: 46 Medium Term Floating Deposits 703 7.00% 100 1.00% 6.00%
No of unitholders: 984 RSA Government Bond 4 247 42.30% 3 999 39.60% 2.70%
Original price: 100 Total 10 041 100.00% 10 078 100.00% -0.37%
Broker p.a. com (A): 0.58% TOP HOLDINGS BY VALUE
Annual fee (A): 1.04% June 2024 December 2023
TER (A) 06/24: 1.06% Short Name/ Units Value %of Units Value %of Difference
TER Perf% (A): 0.00% JSE Code Sector Name (000’s) (R ‘000) Fund (000’s) (R ‘000) Fund (000’s)
R213 SA Bnds 3 462 620 2 932 801 30% 3438 917 2 962 366 29.38% 23 703
Annual fee (C): 0.75%
I2029 SA Bnds 472 277 603 848 6.04% 435 412 557 130 5.53% 36 865
TER (C) 06/24: 0.78% RN2030 SA Bnds 388 500 381 208 3.80% 338 500 333 697 3.31% 50 000
TER Perf% (C): 0.00% NDBB02 SA Bnds 304 000 303 869 3.03% 304 000 306 961 3.04% 0
Trailer fee: 0.05% SBS79 SA Bnds 208 000 209 958 2.09% 208 000 211 280 2.10% 0
PEP06
SA Bnds
Fund value: R10.02bn RES63 SA Bnds 205 000 206 319 2.05% 205 000 206 967 2.05% 0 0
2.00%
201 000
201 748
200 989
201 000
2.00%
Risk rating: Low - Medium SLI8 SA Bnds 200 000 199 477 1.99% 200 000
PlexCrowns: MML07 SA Bnds 199 000 199 137 1.98% 199 000
BID19 SA Bnds 198 000 198 341 1.98% 198 000 200 745 1.99% 0
TOTAL 5 435 947 54.96% 4 980 894 49.40%
Price History Relative Strength to FTSE/JSE All Share
140 index (J203)
1.5
130
1.3
120
1.1
110
0.9
100 0.7
90 0.5
| 15 | 16 | 17 | 18 | 19 | 20 | 21 | 22 | 23 | |15| 16 |17| 18 |19 | 20 |21 | 22 | 23|
268 Profile’s Unit Trusts & Collective Investments — DOMESTIC