
Page 269 - Profiles's Unit Trusts & Collective Investments - September 2024
P. 269
Marriott Balanced Fund of Funds
Marriott Balanced Fund of Funds
Marriott Balanced Fund of Funds
Sector: South African—Multi Asset—
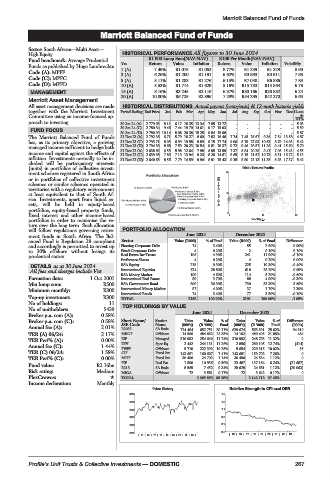
High Equity HISTORICAL PERFORMANCE All figures to 30 June 2024
Fund benchmark: Average Prudential R1 000 Lump Sum(NAV-NAV) R100 Per Month(NAV-NAV)
Funds as published by Hugo Lambrechts Yrs Return Value Inflation Return Value Inflation Volatility
Code (A): MPFF 1 (A) 7.49% R1 075 R1 052 8.77% R1 259 R1 229 8.90
Code (C): MPFC 3 (A) 6.26% R1 200 R1 191 6.62% R3 993 R3 911 7.98
5 (A)
R7 040
6.15%
7.83
5.11%
R1 276
R6 886
R1 283
Code (D): MPFD 10 (A) 5.53% R1 714 R1 629 5.16% R15 733 R15 564 6.76
MANAGEMENT 15 (A) 8.16% R3 245 R2 116 6.37% R30 166 R26 882 6.24
20 (A) 10.00% R6 725 R2 896 7.29% R54 295 R42 270 6.63
Marriott Asset Management
All asset management decisions are made HISTORICAL DISTRIBUTIONS Actual payout (cents/unit) & 12-mnth historic yields
together with the Marriott Investment Period Ending End Price Jan Feb Mar Apr May Jun Jul Aug Sep Oct Nov Dec 12-mn
Committee using an income-focused ap- th
proach to investing. 30 Jun 24 (A) 2 779.03 8.11 6.17 18.35 13.34 7.85 13.72 - - - - - - DY%
5.03
30 Jun 24 (C) 2 780.34 9.46 7.44 19.70 14.61 9.17 15.03 - - - - - - 5.59
FUND FOCUS
30 Jun 24 (D) 2 780.99 10.14 8.08 20.38 15.25 9.84 15.68 - - - - - - 5.87
The Marriott Balanced Fund of Funds 31 Dec 23 (A) 2 792.36 6.71 5.79 18.27 8.60 7.82 16.46 7.74 7.45 26.67 9.36 7.54 13.58 4.87
has, as its primary objective, a growing 31 Dec 23 (C) 2 793.71 8.03 6.99 19.58 9.89 9.15 17.74 9.06 8.79 27.93 10.63 8.79 14.93 5.42
managed income sufficient to hedge both 31 Dec 23 (D) 2 794.38 8.68 7.59 20.23 10.54 9.81 18.37 9.72 9.46 28.57 11.26 9.41 15.60 5.70
income and capital against the effects of 31 Dec 22 (A) 2 638.69 6.53 5.98 12.64 7.98 6.95 13.59 7.37 6.84 20.29 9.47 7.05 15.43 4.55
8.26 14.81
8.31 16.72
9.26
7.89
7.19 13.94
31 Dec 22 (C) 2 639.98
8.15 21.52 10.73
5.13
8.65
inflation. Investments normally to be in- 31 Dec 22 (D) 2 640.63 8.56 7.79 14.59 9.90 8.91 15.43 9.28 8.80 22.13 11.35 8.93 17.37 5.42
cluded will be participatory interests
(units) in portfolios of collective invest- Risk / Return Profile
ment schemes registered in South Africa 20
or in portfolios of collective investment
schemes or similar schemes operated in
territories with a regulatory environment 3yr Compound return(%)
at least equivalent to that of South Af- 10
rica. Investments, apart from liquid as-
sets, will be held in equity-based
portfolios, equity-based property funds,
fixed interest and other income-based 0 0 11 22
portfolios in order to maximise the re- Volatility p.a.
turn over the long term. Such allocation
will follow regulations governing retire- PORTFOLIO ALLOCATION
ment funds in South Africa. The Bal- June 2024 December 2023
anced Fund is Regulation 28 compliant Sector Value (R000) % of Fund Value (R000) % of Fund Difference
and accordingly is permitted to invest up Floating Corporate Debt 74 3.40% 55 2.50% 0.90%
to 30% offshore without losings its Fixed Corporate Debt 4 0.20% 2 0.10% 0.10%
prudential status. Real Estate Inv Trusts 106 4.90% 241 11.00% -6.10%
Preference Shares 4 0.20% 4 0.20% 0.00%
DETAILS as at 30 June 2024 RSA Equity 215 9.90% 225 10.30% -0.40%
All fees and charges include Vat International Equities 624 28.80% 618 28.20% 0.60%
RSA Money Market 100 4.60% 114 5.20% -0.60%
Formation date: 1 Oct 2001 InternationalRealEstate 80 3.70% 88 4.00% -0.30%
Min lump sum: R500 RSA Government Bond 800 36.90% 730 33.30% 3.60%
2.30%
Minimum monthly: R300 International Money Market 87 4.00% 37 1.70% -0.10%
3.40%
77
3.50%
International Bonds
74
Top-up investment: R300 TOTAL 2168 100.00% 2191 100.00% -1.05%
No of holdings: 11
No of unitholders: 5439 TOP HOLDINGS BY VALUE June 2024 December 2023
Broker p.a. com (A): 0.58%
Broker p.a. com (C): 0.58% Short Name/ Sector Units Value %of Units Value %of Difference
JSE Code Name (000’s) (R ‘000) Fund (000’s) (R ‘000) Fund (000’s)
Annual fee (A): 2.01% R2032 SA Bnds 724 484 652 751 30.11% 629 674 563 391 25.62% 94 810
TER (A) 06/24: 2.17% MIIGF Offshore 14 586 484 662 22.35% 14 102 480 405 21.85% 484
TER Perf% (A): 0.00% EIF Managed 310 992 254 640 11.74% 310 992 248 793 11.32% 0
Annual fee (C): 1.44% DIV Spec Eq 2 442 244 131 11.26% 2 856 280 105 12.74% (414)
FWEF Offshore 5 710 222 392 10.26% 5 654 220 315 10.02% 56
TER (C) 06/24: 1.59% CIF Fixed Int 143 681 160 607 7.41% 143 681 159 702 7.26% 0
TER Perf% (C): 0.00% MTIF Fixed Int 30 496 24 702 1.14% 30 496 24 534 1.12% 0
Fund value: R2.16bn PIF Real Est 1 800 10 936 0.50% 23 487 137 164 6.24% (21 687)
0.34%
R213
28 628
SA Bnds
7 452
24 661
(20 063)
1.12%
8 565
Risk rating: Medium MIGA Offshore 72 3 581 0.17% 72 3 642 0.17% 0
PlexCrowns: TOTAL 2 065 853 95.28% 2 142 713 97.45%
Income declaration: Monthly
Price History Relative Strength to CPI excl OER
3000 1.5
2800 1.3
2600 1.1
2400 0.9
2200 0.7
2000 0.5
|15|16 |17|18 |19|20 |21|22 |23| | 15 | 16 | 17 | 18 | 19 | 20 | 21 | 22 | 23 |
Profile’s Unit Trusts & Collective Investments — DOMESTIC 267