
Page 265 - Profiles's Unit Trusts & Collective Investments - September 2024
P. 265
Camissa Top 40 Tracker Fund
Camissa Top 40 Tracker Fund
Camissa Top 40 Tracker Fund
Sector: South African—Equity—Large
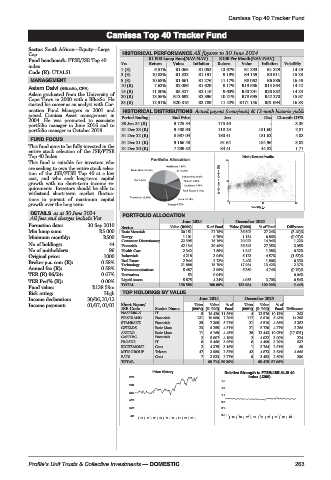
Cap HISTORICAL PERFORMANCE All figures to 30 June 2024
Fund benchmark: FTSE/JSE Top 40 R1 000 Lump Sum(NAV-NAV) R100 Per Month(NAV-NAV)
index Yrs Return Value Inflation Return Value Inflation Volatility
Code (R): UTALSI 1 (R) 6.51% R1 065 R1 052 13.67% R1 293 R1 229 14.49
3 (R) 10.03% R1 332 R1 191 9.19% R4 159 R3 911 15.28
MANAGEMENT 5 (R) 10.68% R1 661 R1 276 11.17% R8 062 R6 886 16.46
10 (R) 7.63% R2 086 R1 629 9.17% R19 686 R15 564 14.42
Aslam Dalvi (BBusSc, CFA) 15 (R) 11.80% R5 327 R2 116 9.60% R40 291 R26 882 14.23
Aslam graduated from the University of
Cape Town in 2000 with a BBusSc. He 20 (R) 13.55% R12 692 R2 896 10.21% R78 695 R42 270 15.97
started his career as an analyst with Cor- 25 (R) 12.91% R20 816 R3 789 11.42% R171 156 R61 994 16.83
onation Fund Managers in 2001 and HISTORICAL DISTRIBUTIONS Actual payout (cents/unit) & 12-mnth historic yields
joined Camissa Asset management in Period Ending End Price Jun Dec 12-mnth DY%
2004. He was promoted to associate
portfolio manager in June 2016 and to 30 Jun 24 (R) 9 725.54 175.46 - 3.36
portfolio manager in October 2018. 31 Dec 23 (R) 9 408.93 118.19 151.60 2.87
31 Dec 22 (R) 8 987.04 180.41 181.62 4.03
FUND FOCUS
31 Dec 21 (R) 9 166.48 91.64 184.96 3.02
This fund aims to be fully invested in the 31 Dec 20 (R) 7 299.52 84.41 44.82 1.77
entire stock selection of the JSE/FTSE
Top 40 Index. Risk / Return Profile
This fund is suitable for investors who 20
are seeking to own the entire stock selec-
tion of the JSE/FTSE Top 40 at a low
cost, and who seek long-term capital 3yr Compound return(%)
growth with no short-term income re- 10
quirements. Investors should be able to
withstand short-term market fluctua-
tions in pursuit of maximum capital
growth over the long term. 0 0 11 22
Volatility p.a.
DETAILS as at 30 June 2024 PORTFOLIO ALLOCATION
All fees and charges include Vat
June 2024 December 2023
Formation date: 30 Sep 2010 Sector Value (R000) % of Fund Value (R000) % of Fund Difference
Min lump sum: R5 000 Basic Materials 30 151 21.76% 36 502 27.24% (5.49)%
Minimum monthly: R500 Energy 1 101 0.79% 1 154 0.86% (0.07)%
No of holdings: 44 Consumer Discretionary 22 395 16.16% 20 022 14.94% 1.22%
Financials 42 134 30.40% 36 643 27.35% 3.05%
No of unitholders: 96 Health Care 2 342 1.69% 1 842 1.38% 0.32%
Original price: 1000 Industrials 4 218 3.04% 6 123 4.57% (1.53)%
2 409
1.80%
2.12%
2 944
Broker p.a. com (R): 0.58% Real Estate 21 888 15.79% 17 984 13.42% 0.33%
2.37%
Technology
Annual fee (R): 0.58% Telecommunications 5 487 3.96% 6 350 4.74% (0.78)%
TER (R) 06/24: 0.67% Derivatives 53 0.04% 0.04%
TER Perf% (R): 0.00% Liquid Assets 5 875 4.24% 4 955 3.70% 0.54%
Fund value: R138.59m TOTAL 138 588 100.00% 133 984 100.00% 3.44%
Risk rating: High TOP HOLDINGS BY VALUE
Income declaration: 30/06, 31/12 June 2024 December 2023
Short Name/
Income payment: 01/07, 01/01 Units Value %of Units Value %of
JSE Code Sector Name (000’s) (R ‘000) Fund (000’s) (R ‘000) Fund Difference
NASPERS-N IT 5 16 420 11.85% 4 13 576 10.13% 263
FIRSTRAND Financials 131 10 099 7.29% 117 8 610 6.43% 14 205
STANBANK Financials 35 7 308 5.27% 31 6 516 4.86% 3 352
GFIELDS Basic Mats 23 6 255 4.51% 21 5 720 4.27% 2 286
ANGLO Basic Mats 11 6 169 4.45% 28 13 443 10.03% (17 691)
CAPITEC Financials 2 5 807 4.19% 2 4 022 3.00% 224
PROSUS IT 8 5 468 3.95% 8 4 409 3.29% 537
RICHEMONT Cons 2 4 375 3.16% 1 3 764 2.81% 69
MTN GROUP Telcom 47 3 980 2.87% 42 4 873 3.64% 4 666
BATS Cons 7 3 833 2.77% 6 3 483 2.60% 390
TOTAL 69 714 50.30% 68 415 51.06%
Price History Relative Strength to FTSE/JSE ALSI 40
9730 index (J200)
1.5
7912
1.3
6094
1.1
4276
0.9
2458 0.7
640 0.5 |15 | 16 |17 | 18 |19 | 20 |21 | 22 |23 |
| 15 | 16 | 17 | 18 | 19 | 20 | 21 | 22 | 23 |
Profile’s Unit Trusts & Collective Investments — DOMESTIC 263