
Page 263 - Profiles's Unit Trusts & Collective Investments - September 2024
P. 263
Camissa SA Equity Fund
Camissa SA Equity Fund
Camissa SA Equity Fund
Sector: South African—Equity—General
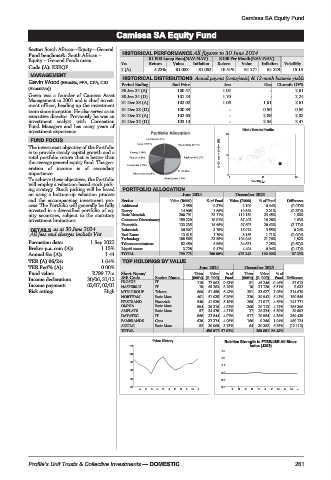
Fund benchmark: South African – HISTORICAL PERFORMANCE All figures to 30 June 2024
Equity – General Funds mean R1 000 Lump Sum(NAV-NAV) R100 Per Month(NAV-NAV)
Code (A): KSEQF Yrs Return Value Inflation Return Value Inflation Volatility
1 (A) 5.23% R1 052 R1 052 10.51% R1 271 R1 229 15.13
MANAGEMENT
HISTORICAL DISTRIBUTIONS Actual payout (cents/unit) & 12-mnth historic yields
Gavin Wood (BBusSc, FFA, CFA, CIO Period Ending End Price Jun Dec 12-mnth DY%
(Executive))
30 Jun 24 (A) 100.57 1.02 - 2.61
Gavin was a founder of Camissa Asset 30 Jun 24 (D) 101.24 1.70 - 2.24
Management in 2001 and is chief invest-
ment officer, heading up the investment 31 Dec 23 (A) 102.02 1.06 1.61 2.61
team since inception. He also serves as an 31 Dec 23 (D) 100.89 - 0.56 0.56
executive director. Previously he was an 31 Dec 22 (A) 102.65 - 2.09 2.03
investment analyst with Coronation 31 Dec 22 (D) 103.13 - 2.55 2.47
Fund Managers and has many years of
investment experience. Risk / Return Profile
25
FUND FOCUS
The investment objective of the Portfolio
is to provide steady capital growth and a 1yr Compound return(%)
total portfolio return that is better than 12
the average general equity fund. The gen-
eration of income is of secondary
importance.
0
10
To achieve these objectives, the Portfolio 0 Volatility p.a. 20
will employ a valuation-based stock pick-
ing strategy. Stock picking will be based PORTFOLIO ALLOCATION
on using a bottom-up valuation process June 2024 December 2023
and the accompanying investment pro- Sector Value (R000) % of Fund Value (R000) % of Fund Difference
cess. The Portfolio will generally be fully Additional 2 958 0.37% 2 100 0.44% (0.07)%
invested in a diversified portfolio of eq- Energy 14 905 1.86% 10 564 2.21% (0.35)%
uity securities, subject to the statutory Basic Materials 200 791 25.11% 112 150 23.45% 1.66%
investment limitations. Consumer Discretionary 159 220 19.91% 87 402 18.28% 1.63%
Financials 133 235 16.66% 97 697 20.43% (3.77)%
DETAILS as at 30 June 2024 Industrials 30 307 3.79% 16 974 3.55% 0.24%
All fees and charges include Vat Real Estate 13 615 1.70% 8 165 1.71% (0.00)%
Technology 188 565 23.58% 104 046 21.76% 1.82%
Formation date: 1 Sep 2022 Telecommunications 52 450 6.56% 34 651 7.25% (0.69)%
Broker p.a. com (A): 1.15% Liquid Assets 3 728 0.47% 4 494 0.94% (0.47)%
Annual fee (A): 1.44 TOTAL 799 773 100.00% 478 242 100.00% 67.23%
TER (A) 06/24: 1.64% TOP HOLDINGS BY VALUE
TER Perf% (A): 0.00% June 2024 December 2023
Fund value: R799.77m Short Name/ Units Value %of Units Value %of
Income declaration: 30/06, 31/12 JSE Code Sector Name (000’s) (R ‘000) Fund (000’s) (R ‘000) Fund Difference
Income payment: 02/07, 02/01 PROSUS IT 118 77 002 9.63% 81 45 246 9.46% 37 613
8 632
IT
8.29%
19
66 283
31 120
6.51%
10
NASPERS-N
Risk rating: High MTN GROUP Telcom 606 51 458 6.43% 291 33 627 7.03% 314 670
NORTHAM Basic Mats 401 51 035 6.38% 220 30 942 6.47% 180 566
FIRSTRAND Financials 540 41 520 5.19% 298 21 917 4.58% 241 771
OMNIA Basic Mats 594 39 316 4.92% 308 20 113 4.21% 286 306
AMPLATS Basic Mats 57 34 478 4.31% 27 26 324 5.50% 29 992
DATATEC IT 868 32 544 4.07% 517 20 954 4.38% 350 439
FAMBRANDS Cons 620 32 374 4.05% 160 9 266 1.94% 460 124
ANGLO Basic Mats 52 30 009 3.75% 64 30 382 6.35% (12 112)
TOTAL 456 017 57.02% 269 891 56.43%
Price History Relative Strength to FTSE/JSE All Share
110 index (J203)
1.5
104
1.3
98
1.1
92
0.9
86 0.7
80 0.5
A S O N D J F M A M J A S O N D J F M A M J
Profile’s Unit Trusts & Collective Investments — DOMESTIC 261