
Page 261 - Profiles's Unit Trusts & Collective Investments - September 2024
P. 261
Camissa Protector Fund
Camissa Protector Fund
Camissa Protector Fund
Sector: South African—Multi Asset—
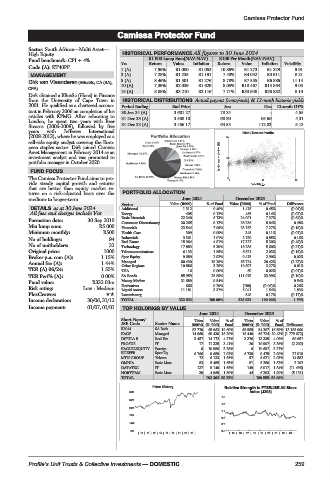
High Equity HISTORICAL PERFORMANCE All figures to 30 June 2024
Fund benchmark:CPI+4% R1 000 Lump Sum(NAV-NAV) R100 Per Month(NAV-NAV)
Code (A): KT40PF Yrs Return Value Inflation Return Value Inflation Volatility
1 (A) 7.96% R1 080 R1 052 10.86% R1 273 R1 229 9.91
MANAGEMENT 3 (A) 7.28% R1 235 R1 191 7.40% R4 042 R3 911 8.21
5 (A) 8.46% R1 501 R1 276 8.78% R7 555 R6 886 11.14
Dirk van Vlaanderen (BBusSc, CA (SA),
10 (A) 7.39% R2 039 R1 629 8.05% R18 467 R15 564 9.05
CFA)
15 (A) 8.08% R3 210 R2 116 7.71% R33 940 R26 882 8.19
Dirk obtained a BBusSc (Hons) in Finance
from theUniversityofCapeTownin HISTORICAL DISTRIBUTIONS Actual payout (cents/unit) & 12-mnth historic yields
2001. He qualified as a chartered accoun- Period Ending End Price Jun Dec 12-mnth DY%
tant in February 2006 on completion of his 30 Jun 24 (A) 3 601.27 78.24 - 4.55
articles with KPMG. After relocating to
London, he spent two years with Bear 31 Dec 23 (A) 3 588.10 68.80 85.69 4.31
Stearns (2006-2008), followed by five 31 Dec 22 (A) 3 456.17 64.55 112.83 5.13
years with Jefferies International Risk / Return Profile
(2008-2013), where he was employed as a 20
sell-side equity analyst covering the Euro-
pean staples sector. Dirk joined Camissa
Asset Management in February 2014 as an
investment analyst and was promoted to 3yr Compound return(%) 10
portfolio manager in October 2020.
FUND FOCUS
The Camissa Protector Fund aims to pro- 0 0 11 22
vide steady capital growth and returns Volatility p.a.
that are better than equity market re-
turns on a risk-adjusted basis over the PORTFOLIO ALLOCATION
medium-to longer-term. June 2024 December 2023
Sector Value (R000) % of Fund Value (R000) % of Fund Difference
DETAILS as at 30 June 2024 Additional 1 312 0.40% 1 476 0.45% (0.06)%
All fees and charges include Vat Energy 405 0.12% 466 0.14% (0.02)%
Formation date: 30 Sep 2010 Basic Materials 22 340 6.73% 24 091 7.37% (0.64)%
Consumer Discretionary 30 265 9.12% 28 236 8.64% 0.48%
Min lump sum: R5 000 Financials 23 544 7.09% 23 762 7.27% (0.18)%
Minimum monthly: R500 Health Care 309 0.09% 345 0.11% (0.01)%
No of holdings: 94 Industrials 3 361 1.01% 2 780 0.85% 0.16%
No of unitholders: 32 Real Estate 15 964 4.81% 17 327 5.30% (0.49)%
Technology 17 883 5.39% 18 286 5.60% (0.21)%
Original price: 1000 Telecommunications 6 133 1.85% 6 621 2.03% (0.18)%
Broker p.a. com (A): 1.15% Spec Equity 9 689 2.92% 9 475 2.90% 0.02%
Annual fee (A): 1.44% Managed 60 430 18.20% 66 724 20.42% (2.22)%
10 886
Other Regions
3.27%
10 697
0.01%
3.28%
TER (A) 06/24: 1.55% USA 16 0.00% 60 0.02% (0.01)%
TER Perf% (A): 0.00% SA Bonds 85 959 25.89% 111 078 33.99% (8.10)%
Fund value: R332.03m Money Market 31 689 9.54% 9.54%
666
Risk rating: Low - Medium Derivatives 11 181 0.20% (180) (0.06)% 0.26%
5 041
3.37%
Liquid Assets
1.83%
1.54%
PlexCrowns: Luxembourg 548 0.17% (0.17)%
Income declaration: 30/06, 31/12 TOTAL 332 032 100.00% 326 833 100.00% 1.59%
Income payment: 01/07, 01/01 TOP HOLDINGS BY VALUE
June 2024 December 2023
Short Name/ Units Value %of Units Value %of
JSE Code Sector Name (000’s) (R ‘000) Fund (000’s) (R ‘000) Fund Difference
R2044 SA Bnds 82 770 65 063 19.60% 69 585 54 207 16.59% 13 185 000
KAGF Managed 14 660 60 430 18.20% 16 440 66 724 20.42% (1 779 672)
DIPULA B Real Est 3 457 14 172 4.27% 3 376 13 335 4.08% 80 651
PROSUS IT 17 11 335 3.41% 20 10 997 3.36% (2 202)
KAGLBLEQUITY Foreign 6 10 886 3.28% 6 10 697 3.27% -
KGEFFB Spec Eq 6 766 9 689 2.92% 6 739 9 475 2.90% 27 019
MTN GROUP Telcom 72 6 133 1.85% 57 6 621 2.03% 14 882
OMNIA Basic Mats 83 5 485 1.65% 81 5 280 1.62% 2 102
DATATEC IT 137 5 140 1.55% 149 6 017 1.84% (11 496)
NORTHAM Basic Mats 39 4 969 1.50% 44 6 203 1.90% (5 131)
TOTAL 193 302 58.22% 189 555 58.00%
Price History Relative Strength to FTSE/JSE All Share
3610 index (J203)
1.5
3068
1.3
2526
1.1
1984
0.9
1442 0.7
900 0.5
| 15 | 16 | 17 | 18 | 19 | 20 | 21 | 22 | 23 | |15 | 16 |17 | 18 |19 | 20 |21 | 22 |23 |
Profile’s Unit Trusts & Collective Investments — DOMESTIC 259