
Page 257 - Profiles's Unit Trusts & Collective Investments - September 2024
P. 257
Camissa Islamic Balanced Fund
Camissa Islamic Balanced Fund
Camissa Islamic Balanced Fund
Sector: South African—Multi Asset—
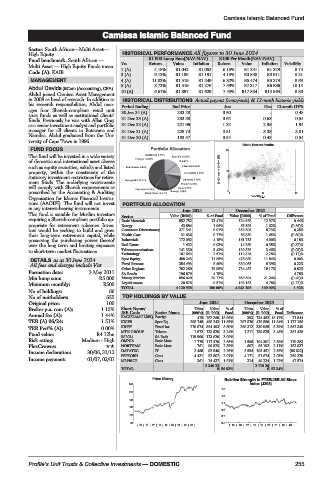
High Equity HISTORICAL PERFORMANCE All figures to 30 June 2024
Fund benchmark: South African — R1 000 Lump Sum(NAV-NAV) R100 Per Month(NAV-NAV)
Multi Asset — High Equity Funds mean Yrs Return Value Inflation Return Value Inflation Volatility
Code (A): KAIB 1 (A) 4.18% R1 042 R1 052 6.15% R1 241 R1 229 8.74
3 (A) 6.12% R1 195 R1 191 4.15% R3 840 R3 911 8.21
MANAGEMENT 4 (A) 11.02% R1 519 R1 249 6.32% R5 474 R5 374 8.63
5 (A) 8.72% R1 519 R1 276 7.59% R7 317 R6 886 10.14
Abdul Davids (BCom (Accounting), CFA) 10 (A) 6.61% R1 897 R1 629 7.45% R17 854 R15 564 8.80
Abdul joined Camissa Asset Management
in 2008 as head of research. In addition to HISTORICAL DISTRIBUTIONS Actual payout (cents/unit) & 12-mnth historic yields
his research responsibilities, Abdul man- Period Ending End Price Jun Dec 12-mnth DY%
ages four Shariah-compliant retail unit
trust funds as well as institutional clients’ 30 Jun 24 (A) 233.28 0.50 - 0.48
funds. Previously he was with Allan Gray 31 Dec 23 (A) 233.38 0.64 0.63 0.54
as a senior investment analyst and portfolio 31 Dec 22 (A) 221.96 1.32 2.98 1.94
manager for all clients in Botswana and 31 Dec 21 (A) 228.74 3.51 3.38 3.01
Namibia. Abdul graduated from the Uni- 31 Dec 20 (A) 183.57 0.54 0.45 0.54
versity of Cape Town in 1996.
Risk / Return Profile
FUND FOCUS 20
This fund will be invested in a wide variety
of domestic and international asset classes
such as equity securities, sukuks and listed 3yr Compound return(%)
property, within the constraints of the 10
statutory investment restrictions for retire-
ment funds. The underlying investments
will comply with Shariah requirements as
prescribed by the Accounting & Auditing 0 0 11 22
Organisation for Islamic Financial Institu- Volatility p.a.
tions (AAOIFI). The fund will not invest PORTFOLIO ALLOCATION
in any interest-bearing instruments.
June 2024 December 2023
This fund is suitable for Muslim investors Sector Value (R000) % of Fund Value (R000) % of Fund Difference
requiring a Shariah-compliant portfolio ap- Basic Materials 552 752 13.41% 524 568 12.97% 0.44%
propriate for retirement schemes. Inves- Energy 43 884 1.06% 65 595 1.62% (0.56)%
tors would be seeking to build and grow Consumer Discretionary 371 341 9.01% 352 806 8.73% 0.28%
their long-term retirement capital, while Health Care 31 636 0.77% 66 830 1.65% (0.89)%
preserving the purchasing power thereof Industrials 172 092 4.18% 161 753 4.00% 0.18%
over the long term and limiting exposure Real Estate 1 432 0.03% 14 260 0.35% (0.32)%
to short-term market fluctuations. Telecommunications 141 330 3.43% 139 825 3.46% (0.03)%
Technology 107 643 2.61% 112 326 2.78% (0.17)%
DETAILS as at 30 June 2024 Spec Equity 488 243 11.85% 478 880 11.84% 0.00%
All fees and charges include Vat Fixed Interest 354 493 8.60% 339 065 8.39% 0.22%
Other Regions 782 260 18.98% 734 452 18.17% 0.82%
Formation date: 3 May 2011 SA Bonds 196 879 4.78% 4.78%
Min lump sum: R5 000 Money Market 856 020 20.77% 859 594 21.26% (0.49)%
Minimum monthly: R500 Liquid Assets 20 876 0.51% 193 182 4.78% (4.27)%
No of holdings: 66 TOTAL 4 120 938 100.00% 4 043 196 100.00% 1.92%
No of unitholders: 655 TOP HOLDINGS BY VALUE
Original price: 100 June 2024 December 2023
Broker p.a. com (A): 1.15% Short Name/ Sector Name Units Value %of Units Value %of
JSE Code
Annual fee (A): 1.44% KAGISLAMGLBEQ Foreign (000’s) (R ‘000) Fund (000’s) (R ‘000) Fund Difference
21 844
415 782 260 18.98%
393 734 452 18.17%
TER (A) 06/24: 1.51% KIGFB Spec Eq 298 748 488 243 11.85% 297 570 478 880 11.84% 1 177 186
TER Perf% (A): 0.00% KIHYF Fixed Int 270 874 354 493 8.60% 268 312 339 065 8.39% 2 562 349
MTN GROUP Telcom 1 572 133 529 3.24% 1 211 139 825 3.46% 361 428
Fund value: R4.12bn RS2034 SA Bnds 119 500 123 620 3.00%
Risk rating: Medium - High OMNIA Basic Mats 1 775 117 476 2.85% 1 596 104 301 2.58% 179 283
PlexCrowns: NORTHAM Basic Mats 761 96 823 2.35% 607 85 192 2.11% 153 937
Income declaration: 30/06, 31/12 DATATEC IT 2 468 92 540 2.25% 2 554 103 451 2.56% (86 622)
PEPKORH Cons 4 421 82 807 2.01% 4 171 81 874 2.03% 250 229
Income payment: 01/07, 02/01 MRPRICE Cons 361 74 437 1.81% 314 49 224 1.22% 47 574
2 346 22 2 116 26
TOTAL 9 56.93% 6 52.34%
Price History Relative Strength to FTSE/JSE All Share
240 index (J203)
1.5
210
1.3
180
1.1
150
0.9
120 0.7
90 0.5
| 15 | 16 | 17 | 18 | 19 | 20 | 21 | 22 | 23 | |15 | 16 |17 | 18 |19 | 20 |21 | 22 |23 |
Profile’s Unit Trusts & Collective Investments — DOMESTIC 255